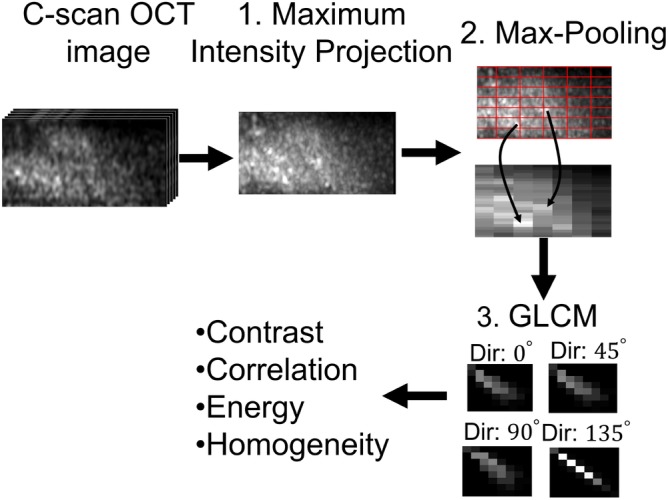
Figure 5.

A summary of the flow diagram to extract Gray Level Co‐Occurrence Matrix (GLCM) properties from optical coherence tomography (OCT) images

A summary of the flow diagram to extract Gray Level Co‐Occurrence Matrix (GLCM) properties from optical coherence tomography (OCT) images