
Figure 6.
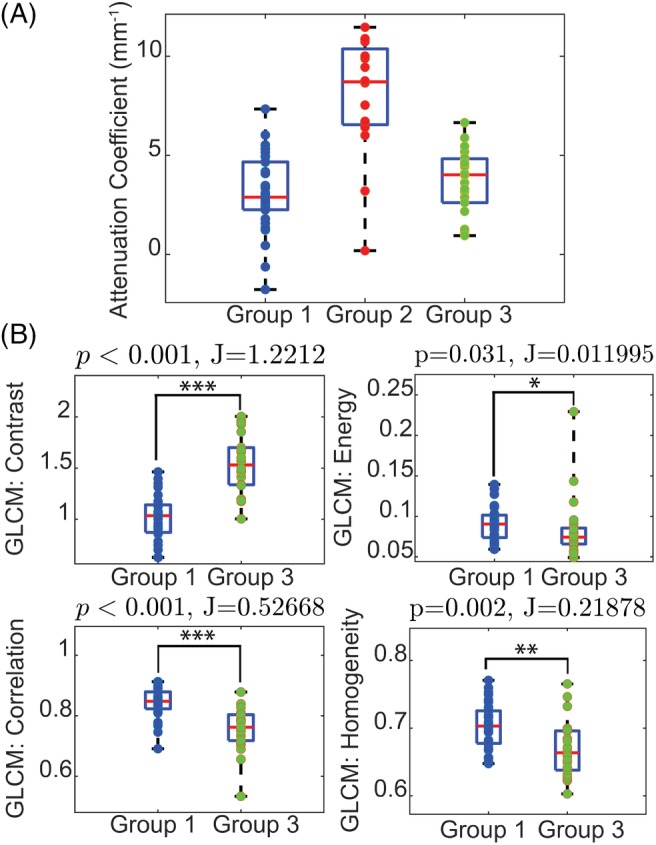
Quantitative analysis of image properties. Group 1: Cortex/Hippocampus, Group 2: Corpus Callosum, Group 3: Striatum/Thalamus (A) The distribution of attenuation extracted from all data sets from the three groups. The corpus callosum has a higher mean attenuation coefficient than gray matter. B, A comparison of the class separability, J, of the four Gray Level Co‐Occurrence Matrix (GLCM) properties as well as the statistical significance difference between the two groups validated with Mann‐Whitney U test. Contrast and correlation achieve high separability with statistical significance (P < .001) between Groups 1 and 3