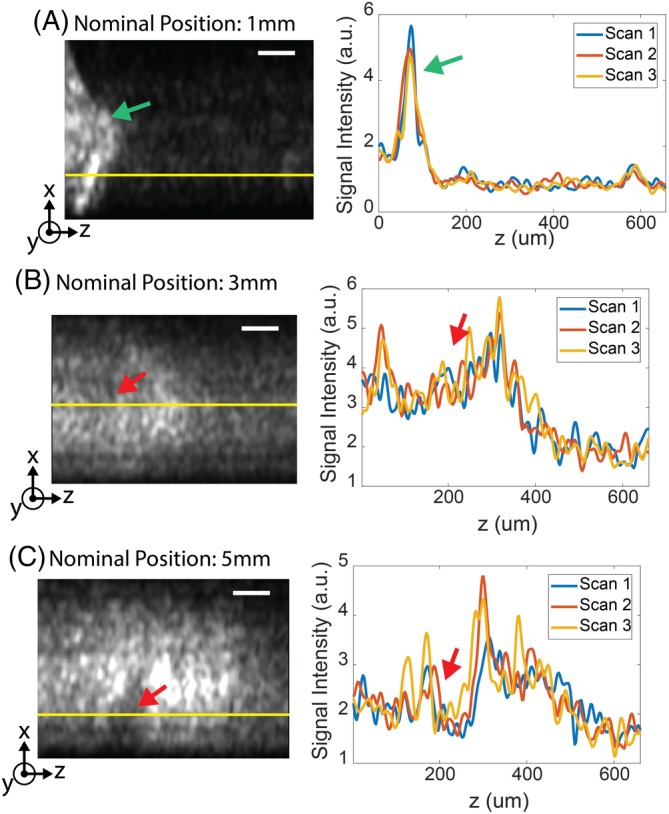
Figure 9.

Selected frames showing optical coherence tomography (OCT)‐resolved depth along the tract, nominally at (A) 1 mm, (B) 3 mm and (C) 5 mm into the brain. The line profiles of the three repeated sweeps along the yellow line are presented. Some structural features, indicated by the red arrows, are preserved over time. The green arrow in (A) indicates potential tissue residue. Scale bar: 100 μm
