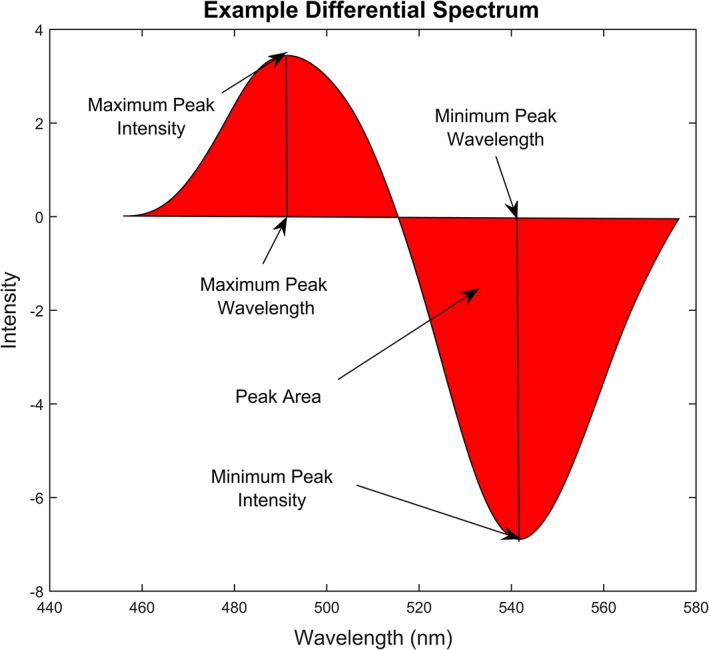
Figure 2.

Example of differential spectrum calculated from the fluorescence spectra before and after exposure to bladder cancer urinary VOC vapour, the spectrum characteristics: maximum peak value and wavelength, minimum peak value and wavelength, and peak area were used for describing the characters of the differential spectrum and to be used as input for CDA
