Figure 3.

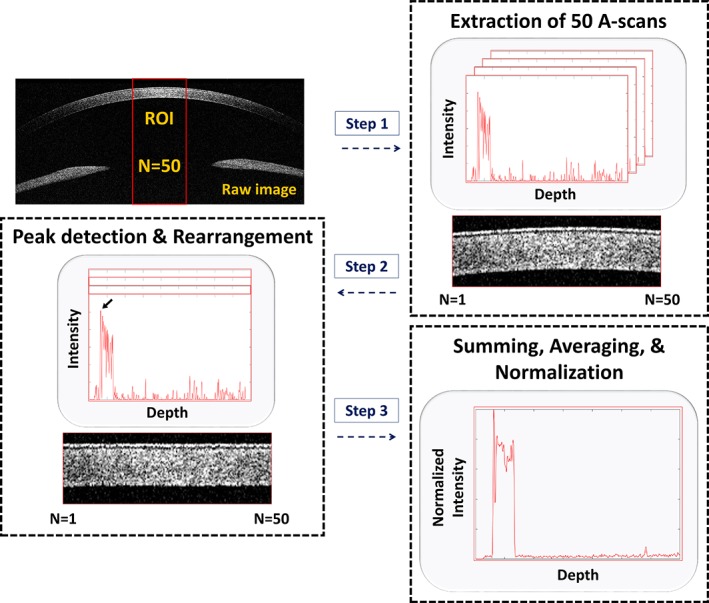
A flow chart representation of the depth‐intensity profile algorithm developed (A‐scans, amplitude scans; ROI, region of interest)

A flow chart representation of the depth‐intensity profile algorithm developed (A‐scans, amplitude scans; ROI, region of interest)