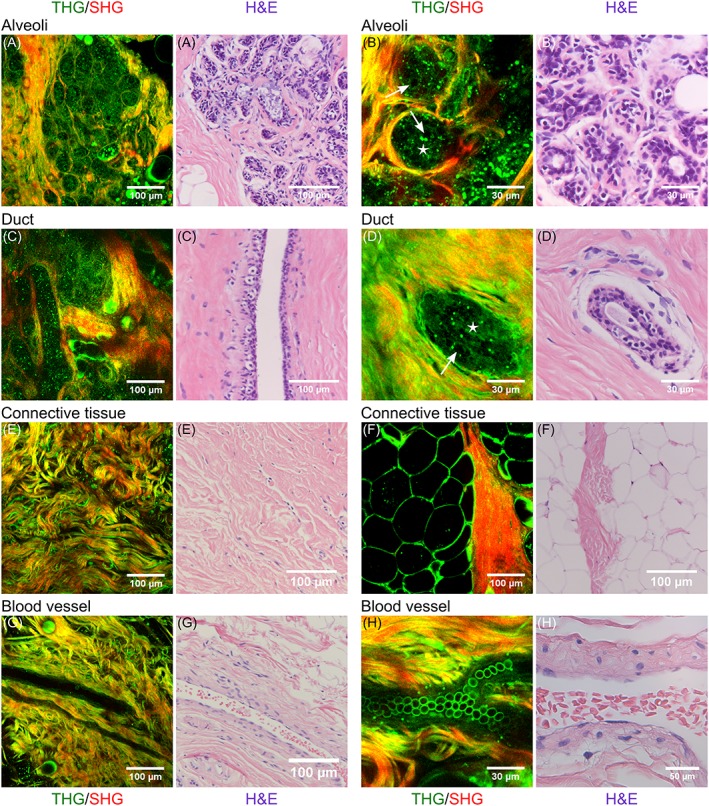
Figure 2.

Combined THG (green) and SHG (red) images of normal human breast tissue (left) compared to the H&E histology of similar structures in the same samples (right). A‐B, alveoli; C‐D, ducts; E, connective tissue; F, fat tissue; G‐H, blood vessels. Epithelial cells and luminal substance inside alveoli and ducts are indicated with arrows and stars respectively. A,D,H, are depth scans of respectively 130, 50 and 30 μm deep with depth steps of 2 μm, and a total acquisition time of respectively 2.6 minutes, 61.6 seconds and 38.4 seconds
