
Fig. 4.
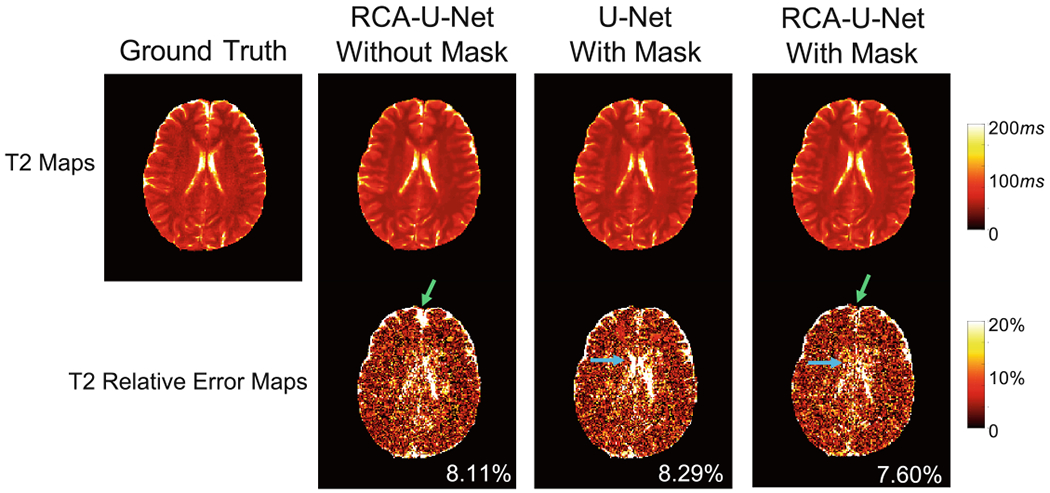
Effect of head masking and residual channel attention block (RCAB) in the quantification of T2. Results are obtained from the standard dataset. Improved T2 quantification due to head masking is noted for brain boundaries, as indicated by the green arrows. Improved T2 quantification due to RCAB is noted for CSF regions, as indicated by the blue arrows. (Color figure online)