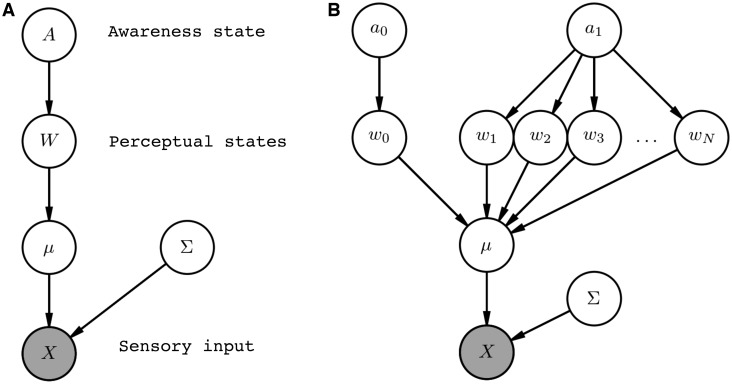
Figure 2.
(A) Probabilistic graphical model of awareness reports. Nodes represent random variables and the graph structure is used to indicate dependencies as indicated by directed arrows. The shaded node indicates that this variable is observed by the system as sensory input. (B) Expanded version of the graphical model from panel (A) that makes explicit the asymmetry in the state space. Figures created using the Daft package in Python.

