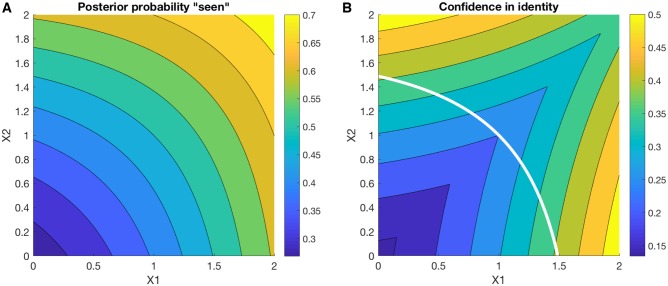
Figure 4.
Simulations of inference on (A) awareness state A and (B) perceptual states W, as a function of sensory input X (where or and Σ is the identity matrix). In panel (A), the posterior probability of a report of ‘presence’ rises from the lower left to the upper right of the grid. In panel (B), confidence in stimulus identify (e.g. left- or right-tilted Gabor) increases towards the corners of the grid. Overlaid in white is the 0.5 contour from panel (A) showing that graded changes in confidence in identity still occur on trials that have a high likelihood of being classed as ‘unseen’ by the model. Confidence in identity was computed as .

