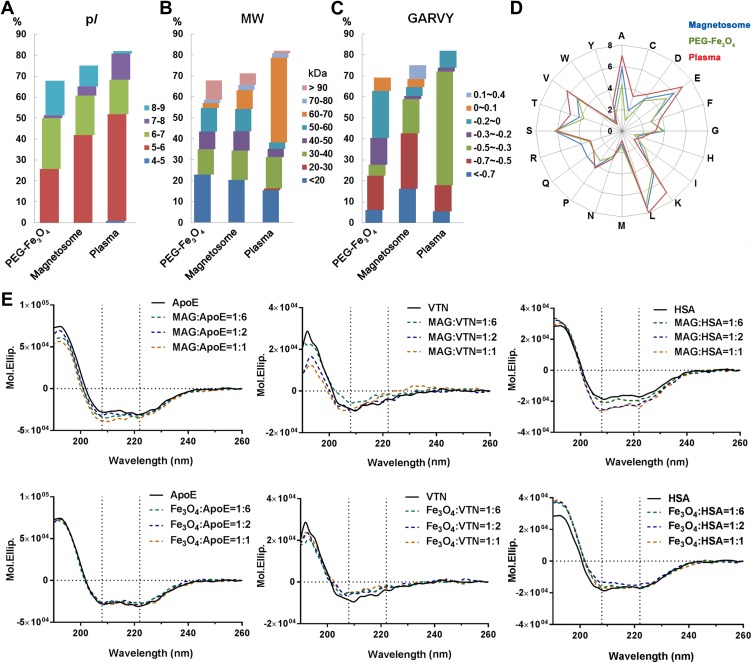
Figure 4.
Characterization of the top 20 abundant plasma proteins identified on magnetosomes by LC-MS/MS. Classifications according to their isoelectric point (pI) (A), molecular weight (MW) (B) or GRAVY values (C). Amino acid compositions are shown in (D). (E) CD spectra of top three magnetosome corona proteins alone (0.02 mg/mL, black line) or in the presence of magnetosome (MAG) or PEG-Fe3O4 (Fe3O4) with different concentrations (0.02, 0.01 and 0.0033 mg/mL Fe concentration, represented by yellow, blue and green dashed lines, respectively). Spectra are shown in mean residue molar ellipticity (Mol.Ellip.). Black dashed lines correspond to spectral peaks at 208 and 222 nm (principle α-helix peak).

