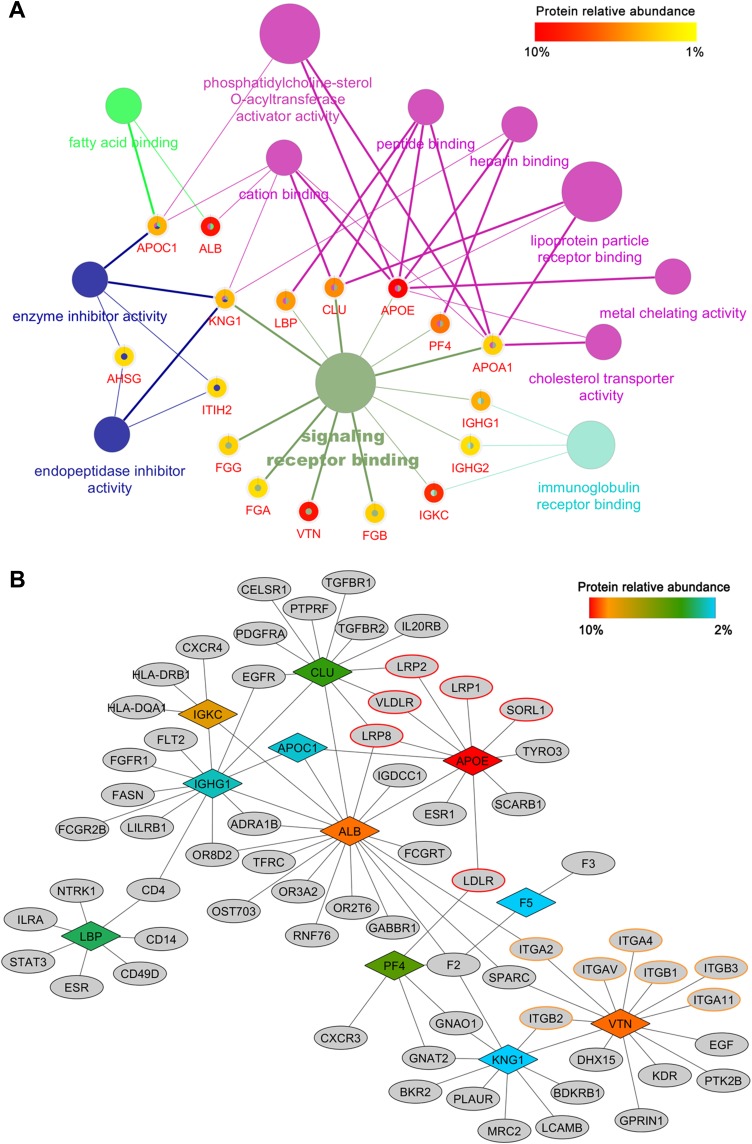
Figure 5.
Bioinformatics analysis of magnetosome-corona protein. (A) GO molecular function enrichment of the top 20 abundant proteins. (p < 0.05) Each protein was represented by a certain gene name; surrounding color shows the relative abundance. Details are given in Table S4. (B) Corona protein-interaction network. Interacted receptors with membrane location were obtained from BioGRID, IMEx, IntAct, MINT and UniProt databases. Abundant corona proteins are colored by their relative abundance.

