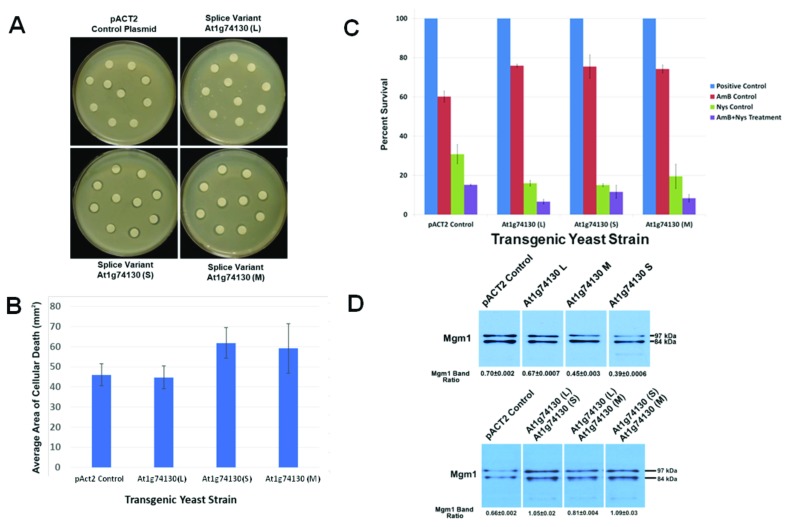
Figure 7. Activity assays for At1g74130 splice variant proteins using transgenic yeasts.
( A) Expression of At1g74130 splice variant proteins in yeast shows activity as increased nystatin sensitivity in a disk assay. Nystatin infused disks were applied on top of transgenic S. cerevisiae lines prepared as top agar cultures at a density of 5 × 10 7 cells per mL. The transgenic yeast line being assessed is indicated: The pACT2 control plasmid line (top left), the line expressing the At1g74130 (L) variant (top right), the line expressing the At1g74130 (S) variant (bottom left) and the line expressing the At1g74130 (M) variant (bottom right). A representative experiment is presented in this panel. ( B) The areas of clearance (degree of cell death) around the nystatin infused disks were compared for the above set of plates (panel A). The pACT2 control line is labelled as pACT2 Control. The splice variant-expressing lines are labelled as in panel A. The average areas of clearance are shown with error bars (standard deviation) (n=10). ( C) Expression of At1g74130 variants in yeast also shows activity as changes to susceptibility to nystatin and amphotericin B. The same lines used in panels A and B were tested here. Each line was treated and then plated on appropriate agar media to determine susceptibility. The Percent Survival was calculated relative to untreated condition (untreated or mock treatments with no antifungals). The blue bars represent the control (no nystatin or amphotericin B), red bars represent cells treated with amphotericin B (AmB), green bars represent cells treated with nystatin (Nys) and the purple bars represent cells treated with both AmB and Nys. Error bars represent variation between two experiments. ( D) Analysis of possible interactions of between yeast Mgm1 and different combinations of At1g74130 splice variant proteins. The top row represents the Mgm1 levels in strains containing pACT2 or expressing one of the At1g74130 variant proteins (note that these immunoblotting results were reported previously from Powles et al. 47 and adapted here for comparative purposes). The bottom row of immunoblots depicts the changes in the ratio of Mgm1 (the uncleaved 97 kDa form versus the cleaved 84 kDa form) when various combinations of At1g74130 splice variant proteins were co-expressed. Each representative immunoblot is labelled accordingly. Only the relevant parts of the immunoblot images are displayed. The ratios were derived from two experiments and the bars represent variation between the two experiments. The immunoblot images used for analyzing the rhomboid combination experiments are provided in Figure S9.

