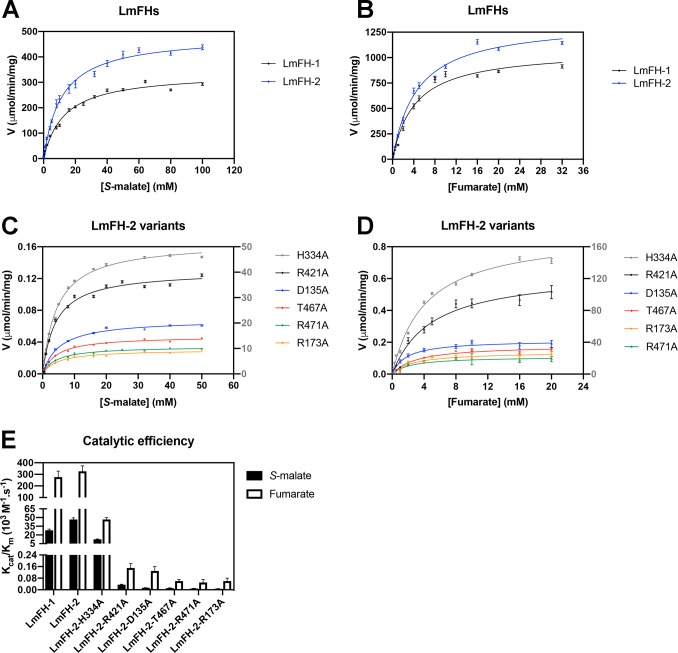
Figure 1.
Initial rates of LmFH isoforms and LmFH-2 variants as a function of S-malate and fumarate concentration. (A) Initial velocities of LmFH isoforms vs S-malate concentration. (B) Initial velocities of LmFH isoforms vs fumarate concentration. (C) Initial velocities of LmFH-2 variants vs S-malate concentration. (D) Initial velocities of LmFH-2 variants vs fumarate concentration. The plots were fit with the Michaelis–Menten equation (eq 1). The Y-axis on the right corresponds to the initial velocities of the LmFH-2-H334A variant, which are colored gray. The error bars were calculated from triplicate reactions. Error bars are given for all measurements but are not easily visible in all cases. (E) Catalytic efficiency (kcat/Km) of LmFH isoforms and LmFH-2 variants for S-malate and fumarate.

