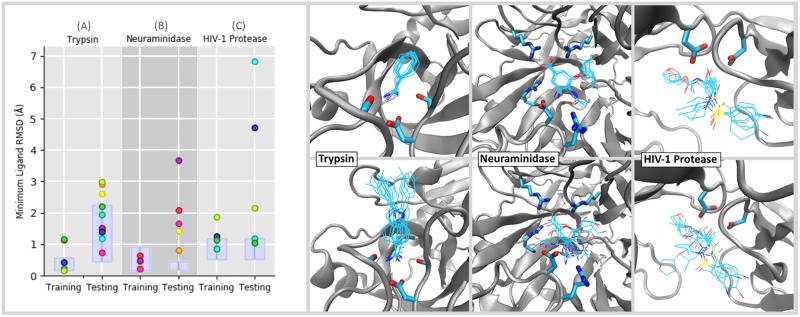
Fig 6. Minimum RMSD values for novice tasks.
(Left) Showing the minimum achieved RMSD of each small ligand novices tried to dock, where each participant is assigned a unique colour. Two ligands were docked for each system, in both ‘training’ and ‘testing’ phases; each ligand is denoted in Fig 2. To determine the extent to which user-identified poses aligned with the native RMSD, a non-interactive Narupa simulation was run for 50 picoseconds in the bound pose and the average RMSD (plus or minus two standard deviations) was calculated, shown as the purple box. The whiskers at the top of each box span 1 Angstrom. (Right) The pose corresponding to the minimum RMSD value shown is on the left for each participant, overlaid on top of one another. Testing tasks for the three are shown in the top row, training tasks are shown on the bottom.

