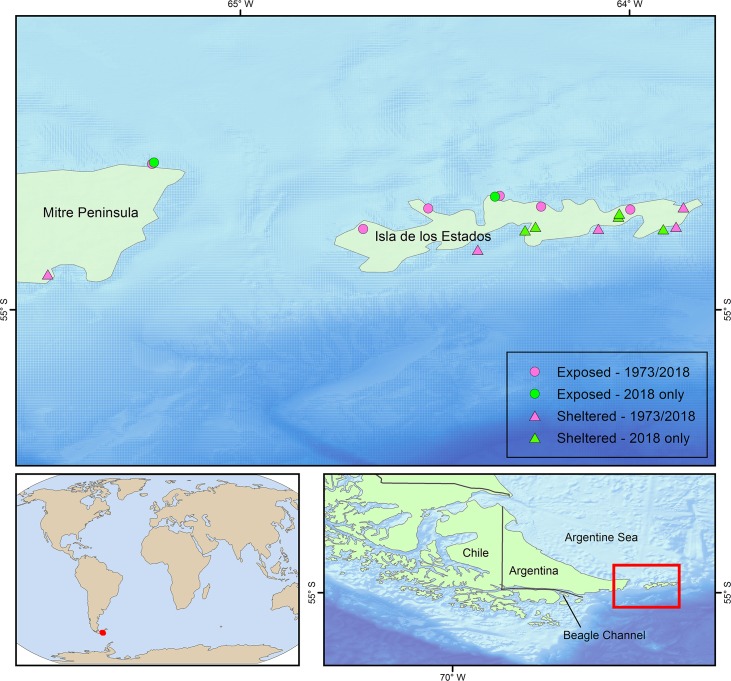
Fig 1. Sampling locations around Isla de los Estados and Mitre Peninsula.
Red–locations sampled in 1973 and 2018; green– 2018 sampling only. Circles represent exposed locations; triangles represent sheltered locations. Data from GEBCO Compilation Group (2019) GEBCO 2019 Grid (doi:10.5285/836f016a-33be-6ddc-e053-6c86abc0788e) and Natural Earth, free vector and raster map data @ naturalearthdata.com.

