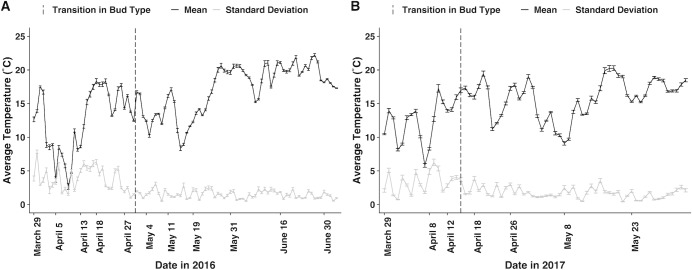
Fig 4. Seasonal temperature data including averaged mean and standard deviation measured in A) 2016 and B) 2017.
For each of the 10 plots, temperature (°C) was measured at 15-minute (2016) and 1-hour intervals (2017). For data visualization, temperature data were grouped by measurement date and averaged to portray single, weekly observations encompassing the entire population. Error bars reflect the standard error, and dashed vertical lines highlight bud type transition, the time at which chasmogamous budding ceased and the first cleistogamous buds were observed.

