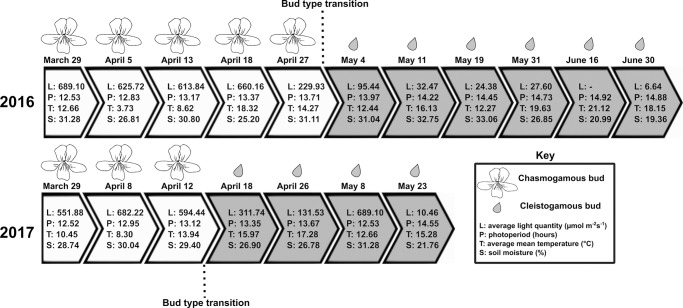
Fig 7. Schematic of measurement days in 2016 and 2017 with corresponding bud types and environmental values that occurred at each date.
White arrows denote dates with chasmogamous buds and gray arrows are dates that cleistogamous budding was observed. L = average light quantity (μmol m-2s-1), P = photoperiod (hours), T = average mean temperature (°C), and S = average soil moisture (%).

