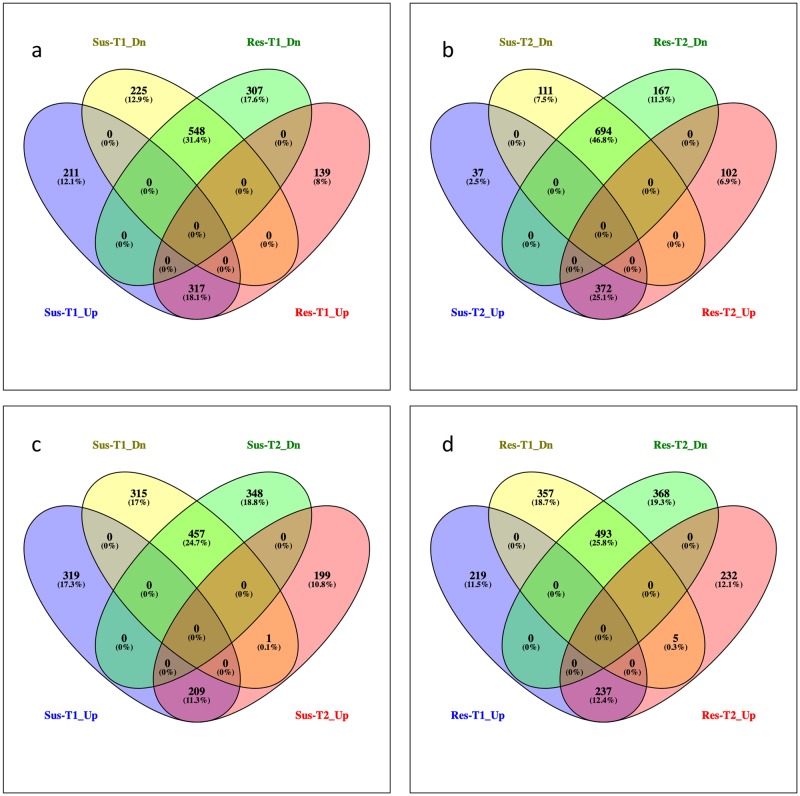
Fig 3. Venn diagrams showing differentially expressed Sclerotinia sclerotiorum genes during interaction with canola.
Venn diagram shows the number of common and unique genes at (a) T1 and (b) T2, between up and down regulated gene sets of NEP32 and NEP63. (c) and (d) shows the comparison of up and down regulated genes at T1 and T2 gene sets of NEP32 and NEP63, respectively.

