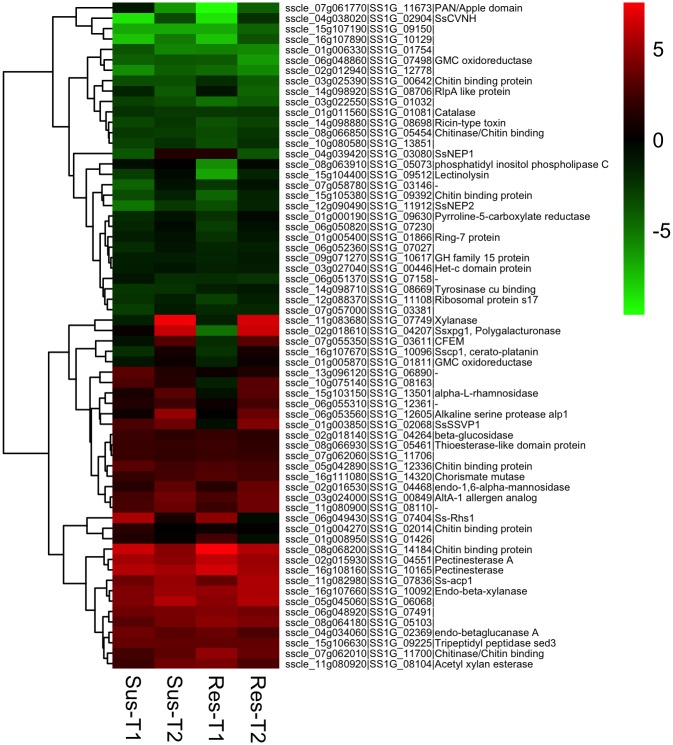
Fig 6. Heat maps showing expression patterns of Sclerotinia sclerotiorum effector genes.
Genes are grouped according to hierarchical clustering based on their expression patterns. T1 and T2 represents earlier (8 and 16 hpi) and later (24 and 48 hpi) time points of interaction. The color gradient represents the log2 fold change in gene expression (up-regulation (red), down-regulation (green), and no change (black)) compared to in vitro control.

