Fig 3.
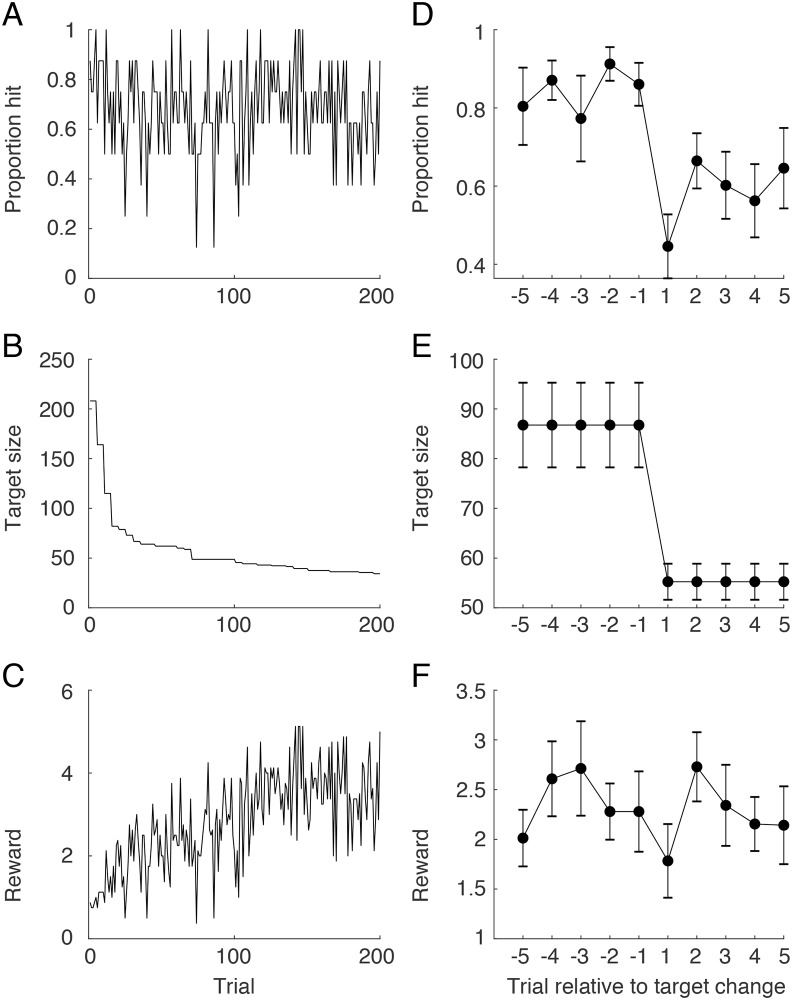
(A-C) Proportion of hits, selected target size, and reward achieved as a function of trial over the entire experiment, averaged across participants. (D-F) The same variables shown for the for the 5 trials before, and 5 trials after, a target switch, collapsing across all switches within a participants and then averaged across participants. Vertical bars represent ± 1 SE.

