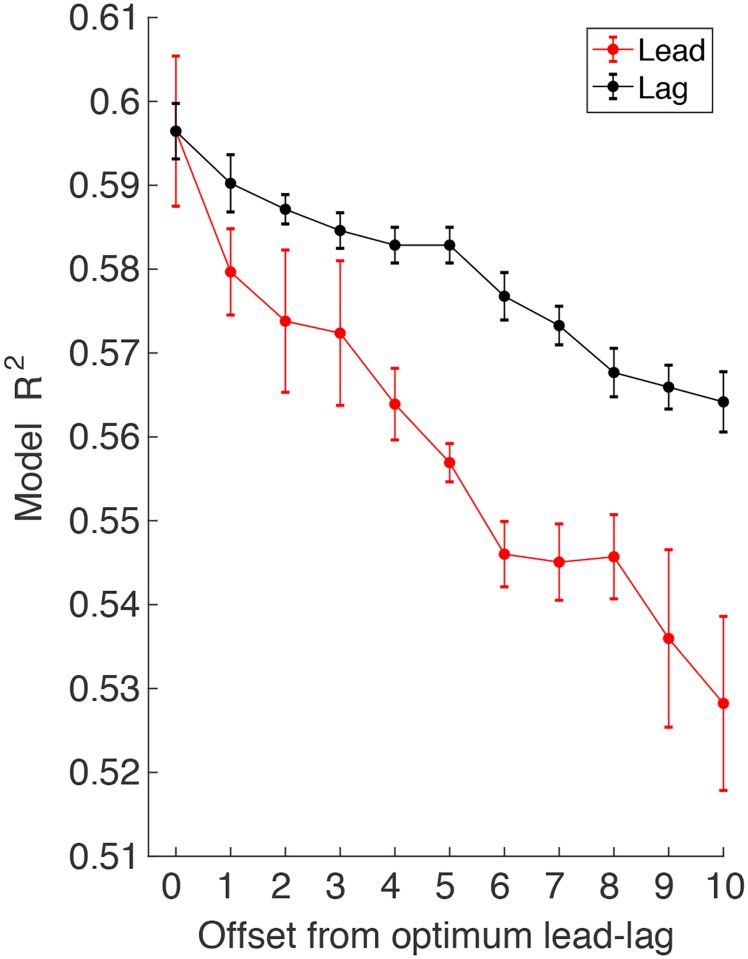
Fig 5. Sensitivity analysis of the lead-lag model fits.
The variance explained (averaged across participants) is shown as the lead and lag are changed from the optimal lead-lag model for each participant. We averaged R2 across for positive and negative offsets up to 10 leads/lags. (Note that for participants with leads or lags less than 10, we took only the offsets we could calculate). The standard error bars were calculated by first removing the mean variance explained for each participant averaged over all leads and all lags (separately), so that the error bars reflect the variability of the decrease in variance explained with offset rather than the variability of the average variance explained across participants.

