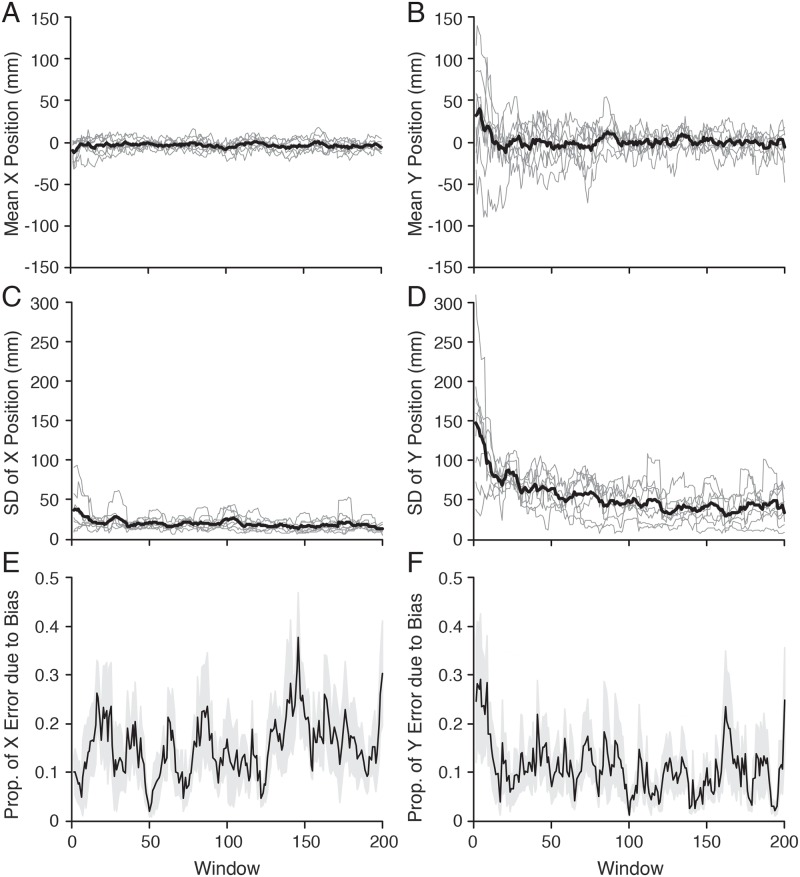
Fig 6. Mean x (A) and y (B) final puck positions and the corresponding x (C) and y (D) standard deviation (SDs) about these means, computed over a moving window of 9 trials.
Thin gray lines represent individual participants and the thick black line represents the average across participants. The mean position provides an estimate of the bias and the SDs provide an estimate of the variance. Panels E and F show, for x and y respectively, the proportion of the mean squared error (MSE) accounted for by the bias, where MSE = (mean bias)2 + variance. The thick black line represents the average across participants and the height of the gray regions represents ±1 standard error.

