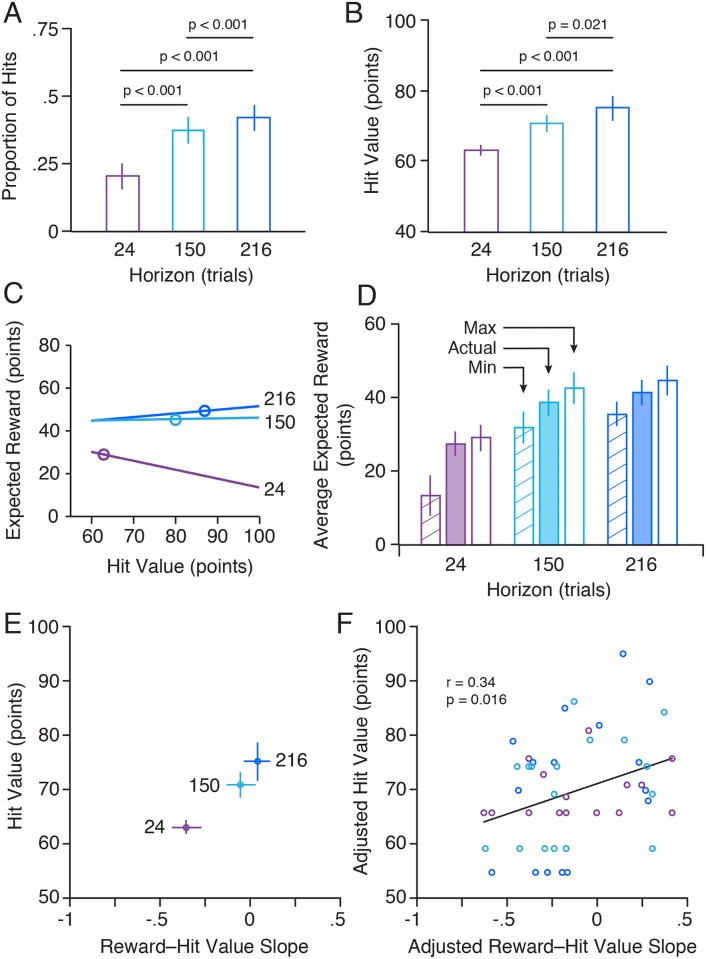
Fig 9.
(A) Mean proportion of hits, averaged across participants, for the short, intermediate, and long horizons (i.e., over the first 24, 150, and 216 trials of the harvesting phase). (B) Mean selected hit value, averaged across participants, for the three horizons. (C) The three lines show, for a single participant, the relationship between hit value and expected reward for each horizon (see numbers). The corresponding circles show the actual hit values selected by the participant for each horizon. (D) Shaded bars show the average reward, earned by participants, for each of the horizons. The open and striped bars show the corresponding maximum and minimum rewards that could have been achieved depending on hit value selection. (E) Average selected hit values as a function of the average slope of the relationship between expected reward and hit value (i.e. slopes of lines in C) for each horizon. (F) Relationship between hit value and the reward-hit value slope, after removing average effects of the horizon (shown in E). Each circle represents a single participant and horizon, and is colour coded by horizon (see E).

