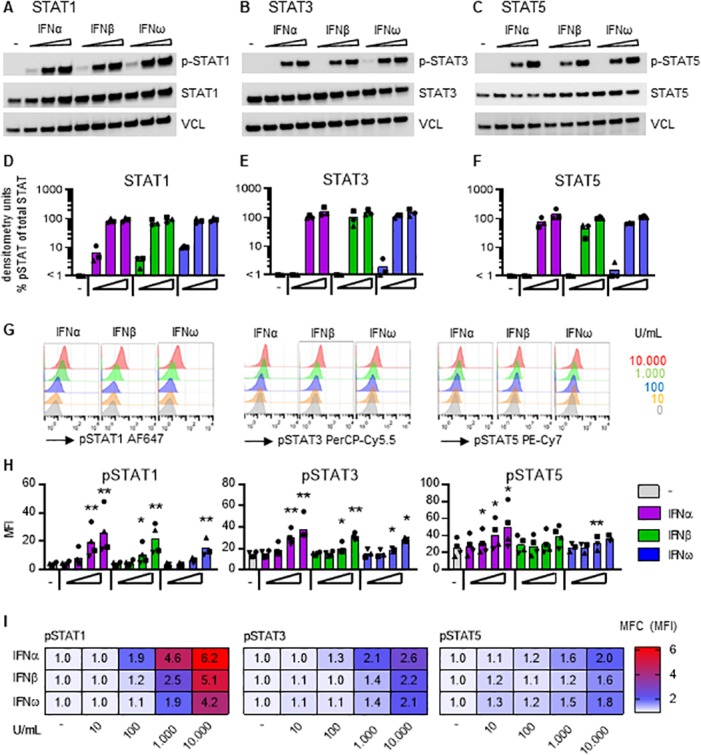
Fig 5. IFN-induced phosphorylation of STAT.

Total CD4+ T cells, isolated from blood donors not living with HIV, were treated for 10 minutes with increasing (0; 100; 1,000; 10,000 U/mL) concentrations of IFNα, IFNβ or IFNω, and phosphorylation of A: STAT1, B: STAT3 and C: STAT5 was detected by Western Blot analysis of cell lysates. Figure shows a representative donor from a total of 3 individual donors that were obtained during 2 independently performed experiments. P-STAT = phosphorylated STAT, STAT = total (unphosphorylated) STAT, VCL = vinculin that is used as loading control. Graphs depict the densitometry analysis of the immunoblot band intensity and show relative STAT phosphorylation as compared to total STAT; D: STAT1, E: STAT3, F: STAT5. G-I: Phosphorylation of (p)STAT1, STAT3 and STAT5 was measured in total CD4+ T cells, isolated from HIV-uninfected blood donors, by flow cytometry after 15 minute treatment with increasing (0–10,000 U/mL) concentrations of IFNα, IFNβ or IFNω, as indicated. G: Representative histograms of flow cytometry analysis showing the IFN-induced change in mean fluorescent intensity (MFI) of the different STAT proteins. H: Graphs showing the IFN-induced changes in pSTAT MFI, bars represent mean values and each symbol represents an individual donor (n = 3–4). I: Heat map shows the mean fold change (MFC) from 3–4 donors of the mean fluorescent intensity (MFI) of the treated condition (shown in H) relative to the untreated condition. *p<0.05, ***p<0.001, as determined with paired student T test. MFI statistics were done on log-transformed data. Fold change calculations used non-transformed raw data.
