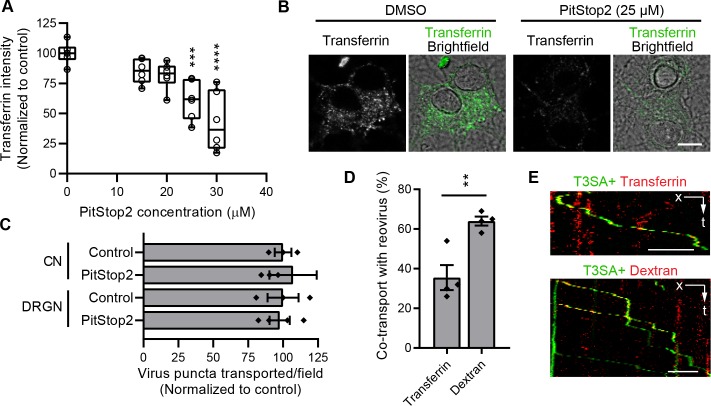
Fig 5. Clathrin-mediated endocytosis is not required for reovirus entry into neurons.
(A) CNs were treated with PitStop2 at he concentrations shown, and the uptake of transferrin-Alexa Fluor 488 was quantified following treatment. Data are presented in a box plot with horizontal bars marking 25th and 75th percentiles and median values, and the whiskers marking extreme values. Individual data points represent means normalized to DMSO-treated controls from three independent experiments, each with duplicate samples. Values that differ significantly from control by ANOVA and Dunnett's test are indicated (***, P < 0.001; ****, P < 0.0001). (B) Representative micrographs show reduced uptake of transferrin following treatment with 25 μm PitStop2 compared with a DMSO-treated control. Scale bar, 10 μm. (C) CNs or DRGNs were treated with 25 μm PitStop2 (Table 1), and T3SA+ puncta transported per field-of-view were enumerated following treatment. Bars indicate means of four samples normalized to DMSO-treated control. Error bars indicate SEM. Individual data points are averages from 8 to 12 fields-of-view per sample. Values did not differ significantly from control as determined by t-test (P > 0.05). (D-E) CNs were incubated with fluorescently-labeled transferrin or dextran (10 kDa) and T3SA+ virions. The percentage of reovirus puncta that co-traffic with transferrin or dextran is shown (D) along with representative kymographs (E). **, P < 0.01 determined by t-test. Bars indicate means of duplicate samples from two independent experiments. Error bars indicate SEM. Individual data points represent averages from 8 to 12 fields-of-view from each sample (n = 184 and 335 reovirus puncta analyzed for co-transport with transferrin and dextran, respectively). Scale bar, 5 μm.

