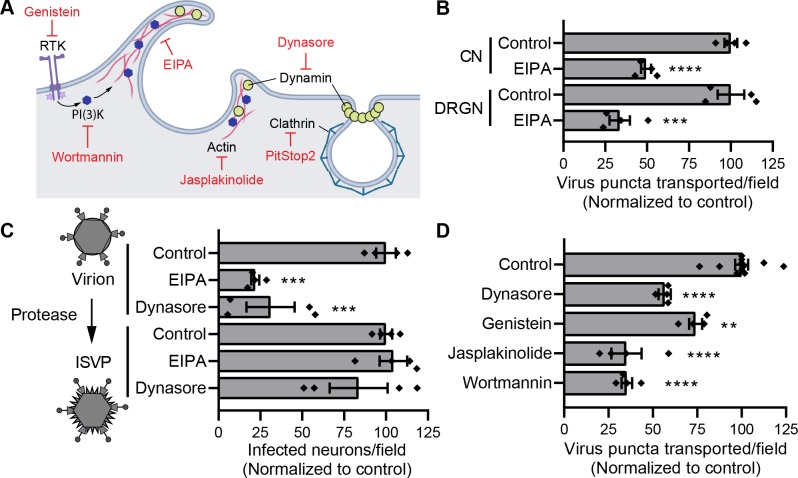
Fig 6. Macropinocytosis-mediated entry is required for reovirus neuronal transport and infection.
(A) Schematic shows host factors mediating endocytic pathways and corresponding small molecule inhibitors (red) (RTK, receptor tyrosine kinase). (B, D) CNs and DRGNs (B) or CNs (D) were treated with the drugs shown (Table 1), adsorbed with T3SA+ virions, and viral puncta transported per field-of-view were enumerated following treatment. (C) CNs were treated with the drugs shown (Table 1), adsorbed with T3SA+ virions or ISVPs at an MOI of 50,000 particles/cell, and infectivity was quantified 24 h post-adsorption. In B-D, bars indicate means normalized to untreated controls. Error bars indicate SEM. Data are representative of at least two independent experiments each with one to three samples. Individual data points are averages from 8 to 12 fields-of-view per sample. Values that differ significantly from control by ANOVA and Dunnett's test are indicated (**, P < 0.01; ***, P < 0.001; ****, P < 0.0001).

