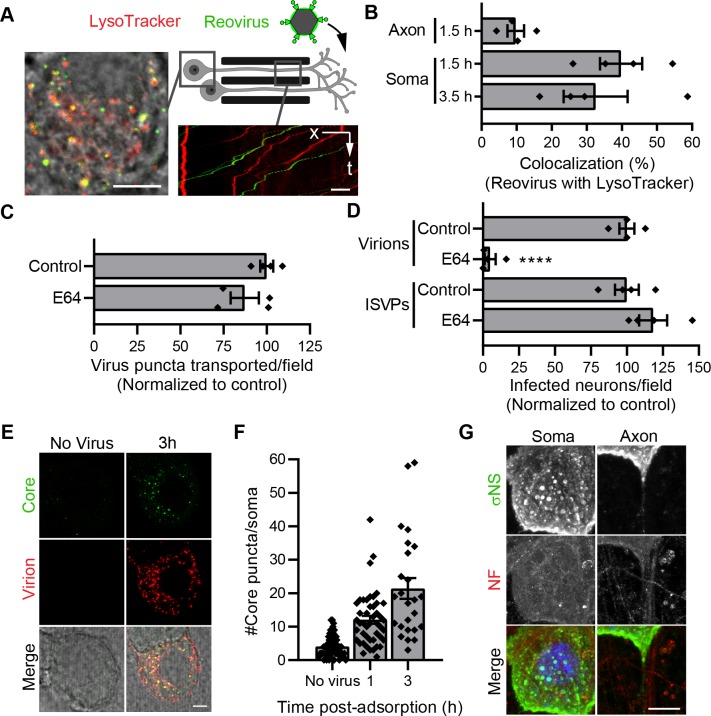
Fig 7. Disassembly of reovirus occurs in neuronal soma following axonal transport.
(A-B) DRGNs cultivated in microfluidic devices were adsorbed in the axonal compartment with fluorescently-labeled T3SA+ virions (green) for 1 h. LysoTracker (red) was added to both compartments during the last 20 min of virus adsorption, and cells were imaged at the times shown after virion addition. Representative images show LysoTracker and reovirus distribution in a DRG soma (A—left, micrograph) and motion in axons within a microgroove (A—right, kymograph). Scale bars, 5 μm. The percentage of reovirus puncta co-transported with LysoTracker in axons within the microgrooves or colocalized with LysoTracker in the soma were quantified (B). Bars indicate means from at least two independent experiments with a total of four devices. Error bars indicate SEM. Individual data points are averages from at least 16 microgrooves containing axons or 8 to 12 fields-of-view containing soma from each device. (C) CNs were treated with E64 (Table 1), and T3SA+ puncta transported per field-of-view were enumerated following treatment. (D) CNs were treated with E64, adsorbed with T3SA+ virions or ISVPs at an MOI of 50,000 particles/cell, and infectivity was quantified at 24 h post-adsorption. In C and D, bars indicate means normalized to untreated controls. Error bars indicate SEM. Data are representative of two independent experiments, each with duplicate samples. Individual data points are averages from 8 to 12 fields-of-view from each sample. Values that differ significantly from control by t-test are indicated (****, P < 0.0001). (E-F) DRGNs were adsorbed with fluorescently-labeled T3SA+ virions (red) for 30 min and incubated at 37°C for 1–3 h before fixation and staining with anti-core polyclonal serum (green). Representative fluorescence micrographs (E) and quantification of the number of reovirus core puncta per soma (F) are shown. Scale bar, 5 μm. Bars indicate means from two samples each with > 23 soma. Error bars indicate SEM. (G) Representative micrographs show distribution of T3SA+ replication factories stained by σNS antiserum and axons stained by an antibody against non-phosphorylated neurofilament H (NF). Scale bar, 10 μm.

