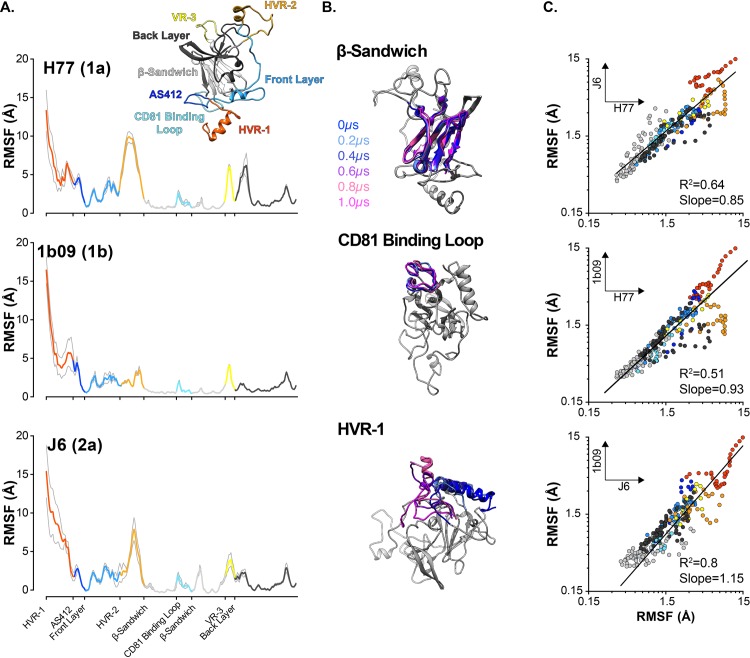
Fig 3. E2 models exhibit consistent protein dynamics.
1μs MD simulations were performed with aglycosylated H77, 1b09 and J6 E2 models. Five independent simulations were performed for each model. A. Average RMSF profiles for each model, color coded by protein region; grey lines indicate standard error of the mean. B. 200ns snapshots taken from a single representative H77 E2 trajectory. In each image the named protein region is color-coded by time; to provide context, the remainder of E2 is shown in grey for the T = 0μs snapshot alone. In each case, structures were aligned using the β-Sandwich as reference and were rotated to highlight the particular protein region. C. Pairwise residue-by-residue comparison of average RMSF values for each model. Data were fitted by log-log regression (GraphPad Prism).

