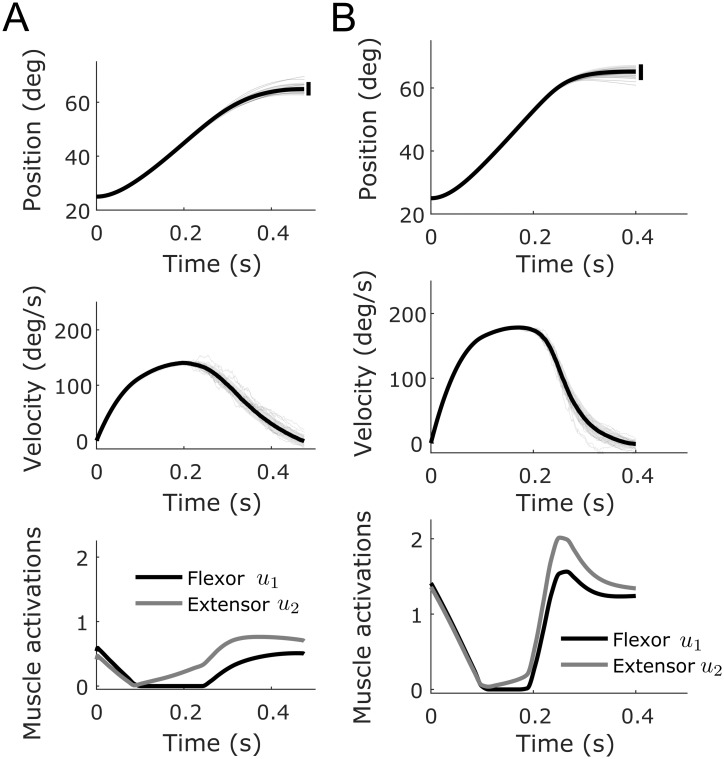
Fig 3. Simulations of pointing movements following the experiment of [64].
A. Simulation with tf = 475 ms and qvar = 50. The mean position and velocity (thick black traces) are reported. Shaded areas correspond to standard deviations. Some individual trajectories are also depicted with thin gray traces. The corresponding optimal open-loop muscle activations are reported (black for flexor and gray for extensor). Co-contraction is necessary to achieve the requested accuracy as actually observed in Fitts-like reaching experiments. B. Simulation with tf = 400 ms and qvar = 500. Same information than in panel A. It is seen that with even more co-contraction, an acceptable accuracy can also be achieved but for faster movements. Note the asymmetry of velocity profiles, with a longer deceleration than acceleration, which is also typical of Fitts’ instructions [66].

