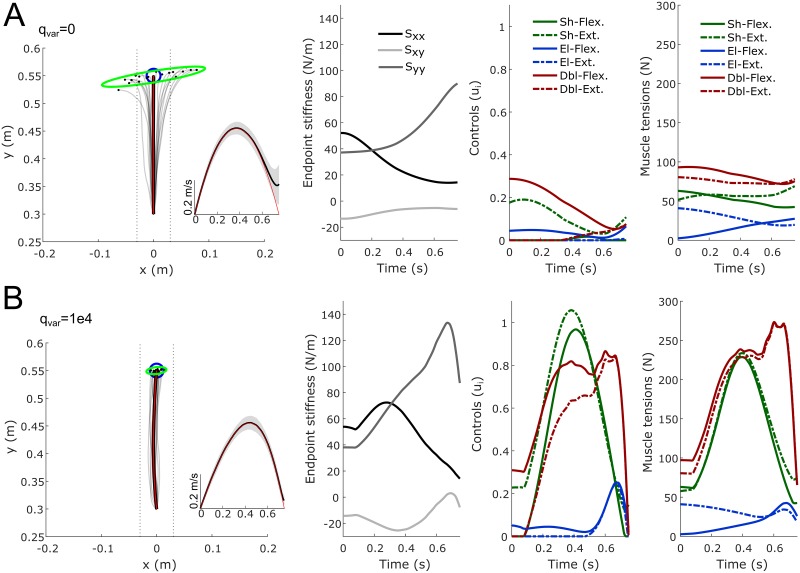
Fig 4. Two-link arm reaching experiment in a divergent force field.
A. Endpoint trajectories (paths and velocity) and stiffness (Cartesian stiffness components Sxx, Syy and Sxy of the matrix S = J−⊤(q)KJ−1(q) where is the joint stiffness) when no penalization of the endpoint variance is considered in the cost (qvar = 0). Twenty sampled paths of the endpoint are depicted (light gray traces). Red traces represent the theoretical mean trajectory from the associated DOC problem and thick black traces represent the mean trajectory over 1000 samples. Vertical dotted lines are displayed to visualize deviations from the straight path (±3cm). The blue circle represents the target (radius of 2.5cm). The green ellipse represents the endpoint positional covariance. The temporal evolution of the mean endpoint stiffness is also depicted (components Sxx, Syy and Sxy). The six muscle activations (open-loop control variables) and the muscle tensions are also reported. Muscles with opposed biomechanical functions were paired (emphasized with the same color, solid lines for flexors and dashed lines for extensors). B. Same information with a weight on the variance cost equal to qvar = 104. A significant increase of co-contraction of agonist/antagonist muscles can be noticed and the improvement in final accuracy is also clear (green ellipse). Note that only an open-loop motor command was employed in these simulations (no on-line state feedback control to correct deviations due to noise and the divergent force field).

