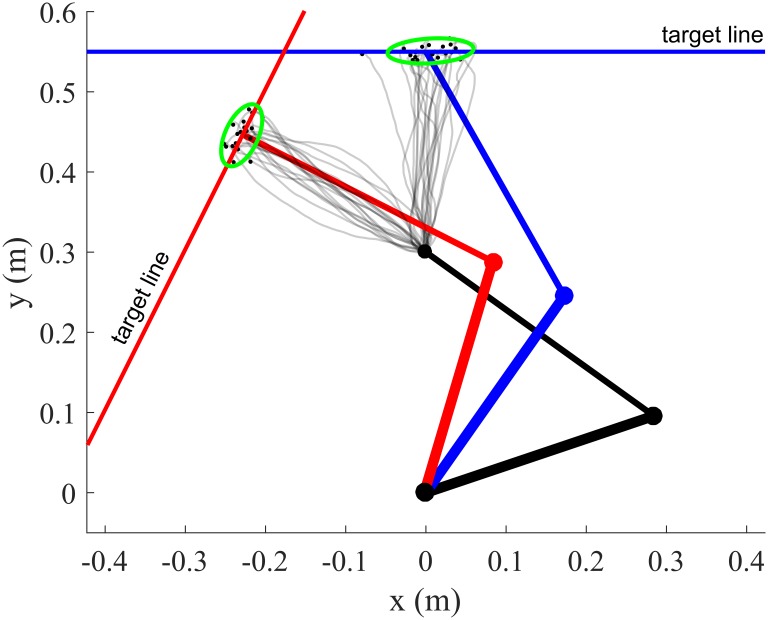
Fig 6. Top view of arm trajectories for a pointing-to-a-line experiment.
The targets are indicated by the solid lines (blue and red). The green ellipse represents the 90% confidence ellipse of the endpoint distribution. Noise was additive (σi = 0.1) in these simulations and movement time was tf = 0.75s for the forward motion (blue) and tf = 0.55s for the leftward motion (red). The variance weight in the cost, qvar, was set to 104 and endpoint variance was penalized in a the direction orthogonal to the target line (via the function n⊤ J(qf)Pq,f J(qf)⊤ n where n is the normal vector, J is the Jacobian matrix and Pq,f is the joint-space positional covariance). Note that hard terminal constraints were imposed on the mean state (mean endpoint position on the target line and zero final mean velocity). The main orientation of the endpoint confidence ellipses is compatible with experimental observations and shows that co-contraction may be used to increase accuracy in the task-relevant dimension.

