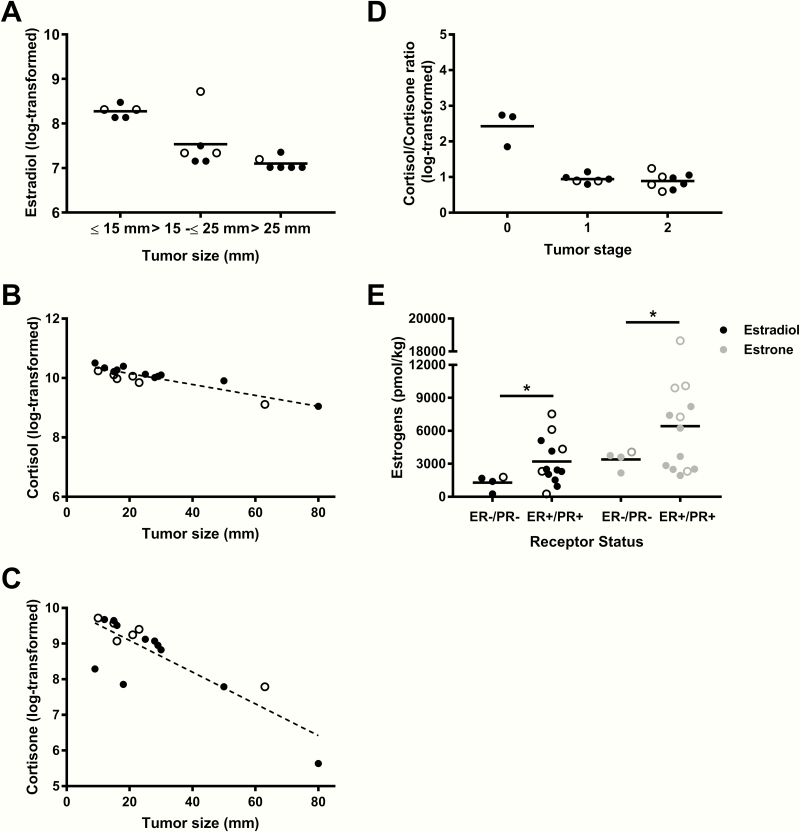
Figure 3.
Breast cancer clinical features and relative breast adipose tissue steroid amounts. (A) Mixed-model regression between relative estradiol amount (log-transformed) and tertiles of tumor size adjusted for menopausal status and current intake of hormonal derivatives (β 2 = –0.9785, β 3 = –1.1197; P = .0488). (B) Mixed-model regression between relative cortisol amount (log-transformed) and tumor size (continuous) adjusted for body mass index (BMI), menopausal status, and current intake of hormonal derivatives (β = –0.02135, P = .0027). (C) Mixed-model regression between relative cortisone amount (log-transformed) and tumor size (continuous) adjusted for BMI, menopausal status, and current intake of hormonal derivatives (β = –0.03636, P < .0001). (D) Mixed-model between cortisol:cortisone ratio (log-transformed) and tumor stage adjusted for BMI (β 2 = –1.8720, β 3 = –1.8316; P = .0410). (E) Difference in relative estradiol and estrone amounts in ER–/PR– vs ER+/PR+ women (P = .0134 and P = .0454). Data on graphs are mean. n = 17. Open circles represent premenopausal women data points and filled circles represent postmenopausal women data points. *P < .05.

