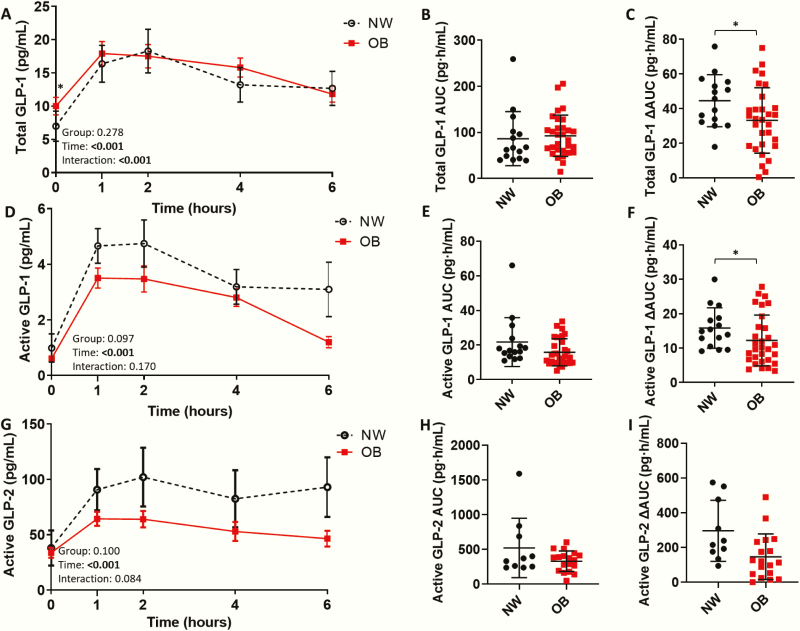
Figure 3.
Impaired total and active glucagon-like peptide (GLP)-1 and active GLP-2 response to dietary fat ingestion. (A) Postprandial total glucagon-like peptide 1 (GLP-1) in normal weight adolescents (NW; n = 15) and adolescents with obesity (OB; n = 30), (B) total GLP-1 area under the curve (AUC), and (C) ∆AUC. (D) Postprandial active GLP-1 in NW and OB groups, (E) active GLP-1 AUC, and (F) ∆AUC. (G) Postprandial active GLP-2 in NW (n = 10) and OB (n = 18) groups, (H) active GLP-2 AUC, and (I) ∆AUC. Postprandial response analyzed by 2-way mixed ANOVA: P values for main effect of group, main effect of time, and group×time interaction shown on graph. AUC and ∆AUC compared using the independent sample t-test, Welch’s t-test, or Mann–Whitney U test. (A,D,G) Mean ± standard error of the mean shown. (B,C,E,F,H,I) Mean ± standard deviation shown. *P < .05; **P < .01; ***P < .001.

