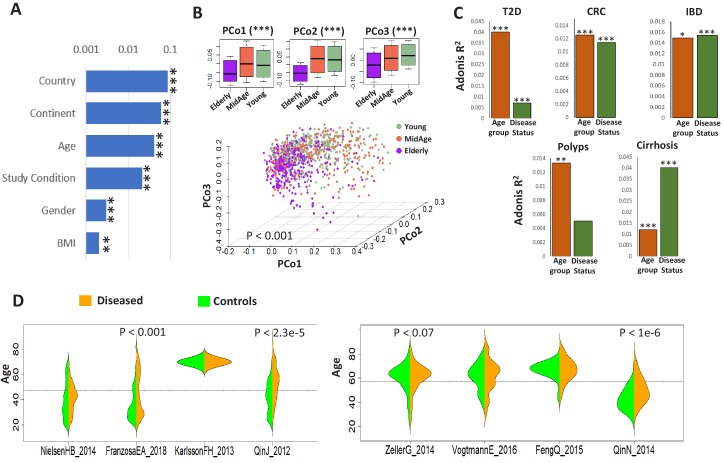
Figure 1. Age influences microbiome composition as well as microbiome-disease signatures.
(A) Bar plots showing the effect (denoted by R2 values computed using PERMANOVA after adjusting for the DNA extraction technique as the confounder) of host factors with microbiome composition in the ExperimentHub repository. Only metadata available for at least 30% of the samples are shown. The p-values for the significance of association are also indicated as ****: p<0.0001; ***: p<0.001, **: p<0.01, *: p<0.05. (B) Principal Co-ordinate Analysis (PCoA) plots of the species profiles of the ‘control’ samples grouped into three age ranges, Young (20–39 years), Middle (40–59 years) and Elderly (60 years and above). The significance (p-value) of the differences between the three groups, computed using PERMANOVA (adonis) after considering the country-specific differences and the DNA extraction technique, is also indicated. The boxplots on the top show the variation of the top three PCoA coordinates for the samples belonging to the three age-groups. The elderly harboured a significantly different microbiome compared to the young/middle-aged. (C) Barplots of PERMANOVA R2 values showing the variation of microbiome with disease (adjusting for age-group) and age-group (adjusting for disease status) in the five disease cohorts. The Cohort-specific analyses ensured that the variations observed were not due to country-specific regional differences in microbiome composition. However, within each cohort, there were skews in the representation of diseased and control samples from different age-groups (as seen in Table 1). Furthermore, in four out of the eight cohorts, there were significant differences in the age variation of control and diseased individuals, as shown by the beanplots in D.


