. 2020 Mar 11;9:e50240. doi: 10.7554/eLife.50240

Figure 2. Microbiome-disease signatures display specific age group centric trends.

Boxplots showing the variation of disease-classification area under the curve (AUCs) when classifiers trained on one age-group were tested on either the same (denoted as SameAge or Same Age-group classification) or different age-groups (denoted as DiffAge or Different Age-group classification) for (A) IBD (B) T2D (C) CRC (D) Polyps and (E) Cirrhosis. Each point denotes the median AUC (of 20 iterations) obtained using each of the 100 sub-sample based Random Forest classifier models when tested on samples from the Same Age-group (in blue) or Different Age-groups (in red). Median AUC values obtained for the same classifier for Same Age-group and Different Age-group classification are joined by grey lines. Scenarios where in the Same Age-group classification had a significant increase of classification AUC as compared to the Different Age-group are indicated (using the P-values of significance). The Wilcoxon signed rank test p-values of significance, after correction using Holm method, are indicated as ***: p<0.001, **: p<0.01, *: p<0.05.

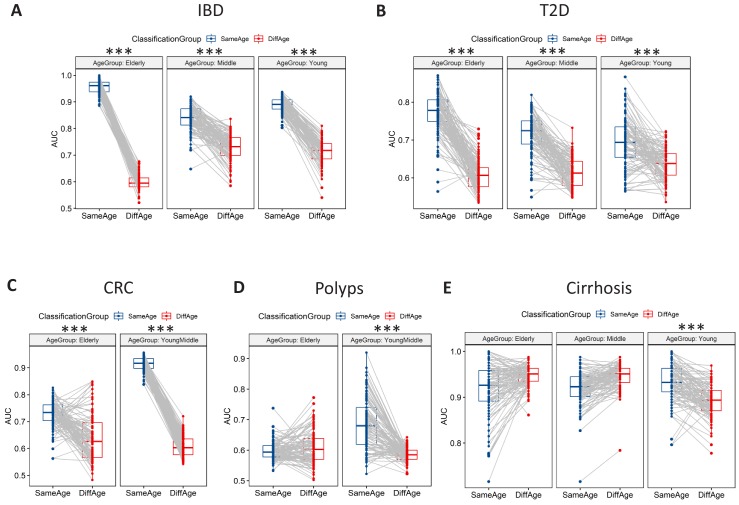
Figure 2—source data 1. Number of disease and control samples in different age-groups obtained by collating samples from datasets from the same (A) Countries and (B) Continents as the disease-specific datasets.
For the disease-specific country bins, the minimum number of diseased samples across any age-groups are indicated. For the Random Forest (RF) based analysis, the training and testing subset sizes (fixed for each disease as 50% of the above number). The shortened notations for the different country used are ESP: Spain; USA: United States, CHN: China, SWE: Sweden, AUT: Austria, FRA: France.

Figure 2.

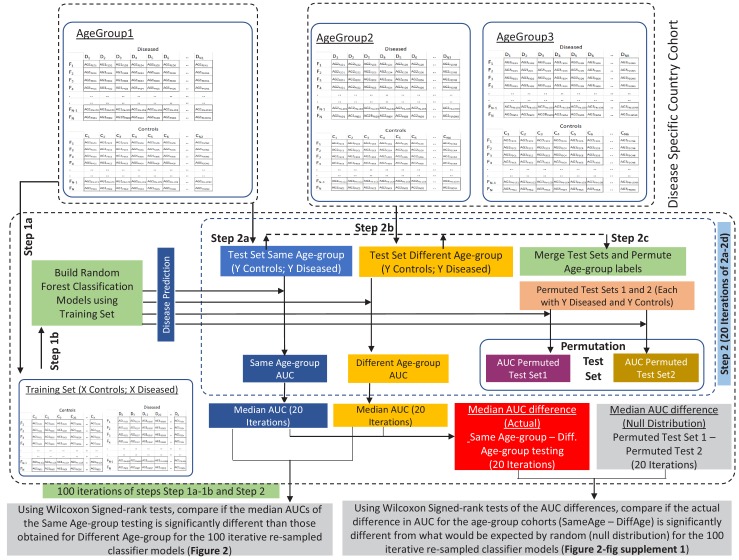
Figure 2—figure supplement 1. Schematic workflow of the methodology adopted for comparing the performance of disease-specific random forest classifiers trained on one age-group when applied to test samples from the same (Same Age-group classification) or different age-groups (Different Age-group classification) using Wilcoxon Signed Rank tests.

Figure 2—figure supplement 1.

Workflow also describes the permutation test based strategy adopted to investigate whether the observed differences in classification AUCs (Same Age-group classification – Different Age-group classification) are significantly high than would be expected at random (Null distribution). The training set and test set sub-sample sizes are X and Y, respectively (refer to Figure 2—source data 1). A similar strategy was adopted for all the three age-groups and all the five diseases (refer to the Materials and methods for the detailed description).
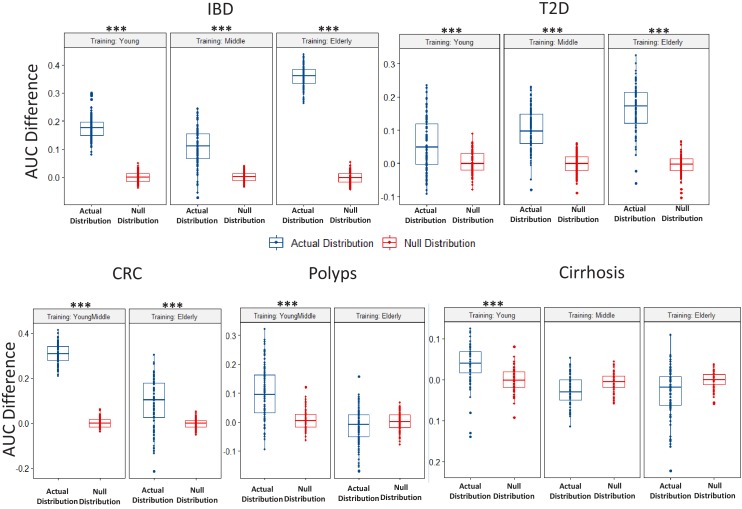
Figure 2—figure supplement 2. Boxplots comparing the actual AUC differences (that is, median AUC for same age-group classification – median AUC for the different age-group classification) obtained for classifiers (in each disease-age-group scenario) with the null distribution of AUC differences obtained between two permuted sets (as obtained in the Permutation tests).

Figure 2—figure supplement 2.

While the blue points denote the actual increase of the median AUCs obtained for the Same Age-group classification with respect to that obtained for the different age-group classification, the red points denote the differences of the AUCs observed between the permuted test sets. Scenarios where in the actual difference of AUC are significantly higher than would be expected by random (in the null distributions) are indicated (using the P-values of significance). The Wilcoxon signed rank test p-values of significance, after correction using Holm method, are indicated as ***: p<0.001, **: p<0.01, *: p<0.05.