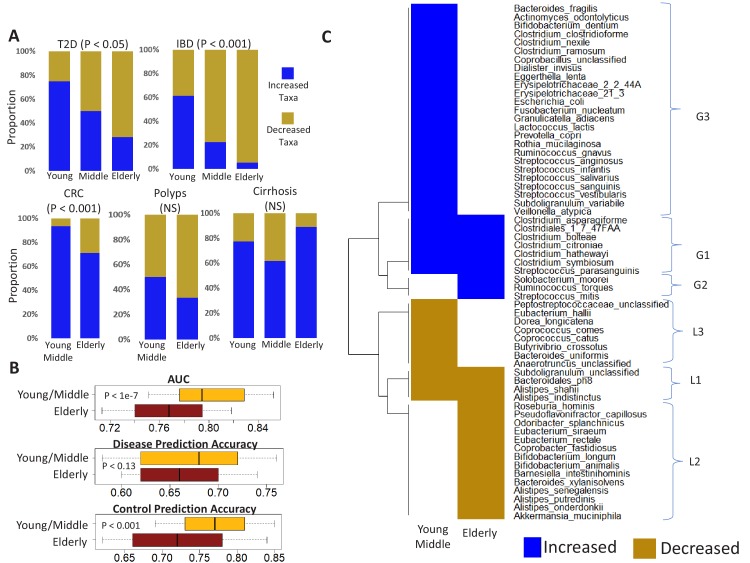
Figure 5. Age-related microbiome changes affect taxon abundance alterations for specific diseases, as well as the microbiome response shared by multiple diseases.
(A) Comparison of the relative proportions of more abundant and less abundant disease-specific marker taxa across the young, middle-aged and elderly age-groups for the five diseases. For each disease-age-group scenario, we checked for the directionality (increased abundance in disease v/s decreased in disease) of association of the corresponding top disease-predictors by comparing their abundance trends in the control and diseased samples belonging to the specific age-groups (See Materials and methods). To ensure that the results thus obtained were not affected by regional variations in microbiome composition, we again restricted these comparisons to the disease-specific continent cohorts. (B) Comparison of the disease prediction AUCs, the disease classification sensitivity and control classification specificity of generic disease prediction models obtained for the elderly and young/middle-aged groups. Overall, the generic disease classifiers had a significant decrease in performance in the elderly age groups, indicating that shared microbiome response may be reduced in the elderly. Moreover, the loss of performance was especially significant with respect to the discrimination of control samples from disease (C) Heatmap of marker species showing consistent trends of either increase or decrease in at least two diseases in the elderly and young/middle-aged groups. Blue indicates consistent increase in two or more diseases, red indicates decrease in two or more diseases. Based on their patterns of increase or decrease across the two age-groups, the taxa could be classified into six groups, namely G1-G3 and L1-L3.


