
Fig. 1. Level of behavioral responsiveness across datasets and CAPs.
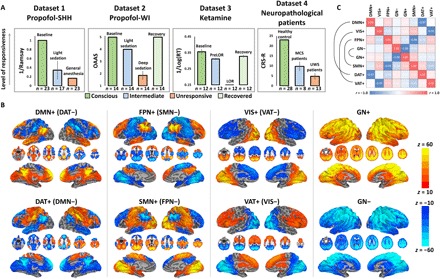
(A) Dataset 1 (propofol-SHH) adopted Ramsay scale. Dataset 2 (propofol-WI) adopted observer’s assessment of alertness/sedation (OAAS). Dataset 3 (ketamine) adopted a button press task for every 30 s. Reaction time (RT) in milliseconds with respect to each instruction was recoded. By comparing the timing of verbal instruction and actual responsiveness during and after ketamine infusion, the periods during which a participant retained responsiveness (PreLOR), loss of responsiveness (LOR), and recovery of responsiveness were determined. Dataset 4 (neuropathological patients) adopted Coma Recovery Scale–Revised (CRS-R). Level of responsiveness is shown by the total score of six subscales (auditory, visual, motor, verbal, communication, and arousal). MCS, minimally conscious state. Error bars indicate ±SD. (B) Spatial maps of eight CAPs. The CAPs consist of DMN+, DAT+, FPN+, SMN+, VIS+, VAT+, GN+, and GN−. (C) The eight CAPs are composed of four pairs of mirror motifs with a strong negative spatial similarity, including DMN+ versus DAT+, VIS+ versus VAT+, FPN+ versus SMN+, and GN− versus GN+.