
Fig. 2. Occurrence rates of CAPs.
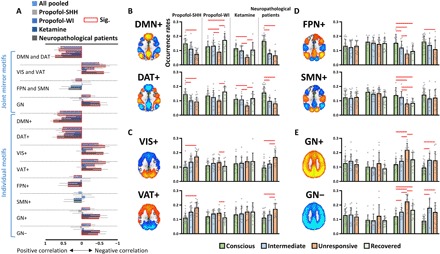
(A) Spearman rank correlations between the occurrence rates of joint mirror motifs or individual CAPs and the level of responsiveness. (B to E) The CAP occurrence rates in different conditions (conscious, intermediate, unresponsive, and recovered) and in different datasets. Intermediate conditions refer to propofol light sedation, PreLOR of ketamine induction, and patients with MCS; unresponsive conditions refer to propofol general anesthesia and deep sedation, LOR due to ketamine, and patients with UWS. Red squares in (A) and lines in (B) to (E) indicate significance at FDR-corrected α < 0.05. See fig. S4 and table S1 for full statistics. Error bars in (A) indicate 95% confidence interval, and error bars in (B) to (E) indicate ±SD.