
Fig. 6. Stimulus modulations of CAPs and control analysis in psychiatric patients.
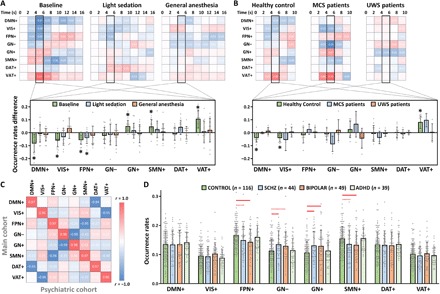
(A) Stimulus-induced CAP occurrence rate changes (against stimulus onset, t = 0) in baseline conscious condition, light sedation, and general anesthesia (n = 15). Student’s t tests (against zero) for the CAP occurrence rate changes were performed during the peak period of stimulus-evoked fMRI signal activity (4 to 6 s). Asterisks indicate significance at α < 0.05 after FDR correction. (B) Stimulus-induced CAP occurrence rate changes in healthy controls (n = 12), patients with MCS (n = 4), and patients with UWS (n = 6). (C) Spatial similarity of the eight CAPs between the main cohort and psychiatric cohort data. (D) Comparisons of the CAP occurrence rates for healthy control participants (CONTROL) versus schizophrenic (SCHZ), bipolar disorder (BIPOLAR), and attention deficit/hyperactive disorder (ADHD) patients by Student’s t tests. Red solid lines indicate significant group differences at α < 0.05 after FDR correction, and red dash lines indicate uncorrected significance at P < 0.05. Error bars indicate ±SD.