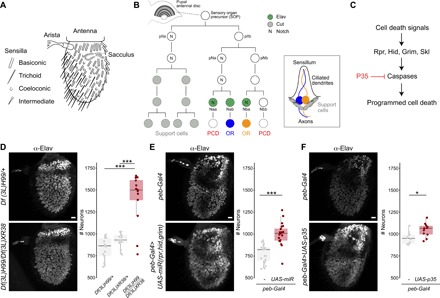
Fig. 1. Inhibition of developmental PCD results in increased neuron numbers in the antenna.

(A) Schematic of the D. melanogaster third antennal segment highlighting different sensory structures. (B) Schematic of the lineage of an antennal disc SOP cell that gives rise to a sensillum containing two neurons (illustrated on the right). The expression of a subset of molecular markers is shown: Elav is expressed in only three of four neural precursors; one of these (Naa) and the Elav-negative cell (Nbb) are eliminated by PCD. The lineage is based on data from (13, 14, 19). (C) Simplified summary of the PCD pathway in D. melanogaster, highlighting the elements relevant for this study. Several intermediate steps between the proapoptotic proteins (Rpr, Grim, Hid, and Skl) and the executioner caspases are not shown. (D) Representative images of anti-Elav immunofluorescence in whole-mount antennae from control [Df(3L)H99/+; the wild-type chromosome here and in other genotypes was derived from a w1118 parent] and PCD-deficient [Df(3L)H99/Df(3L)XR38] animals. Scale bar, 10 μm. Right: Quantifications of antennal neuron numbers of the indicated genotypes, including an additional control genotype [Df(3L)XR38/+] (n = 14, 14, and 13, respectively). Mixed sexes were analyzed; in all other experiments, female flies were used, except where noted otherwise. ***P = 0.0007216 for the comparison to Df(3L)H99/+ and P = 0.0013224 for the comparison to Df(3L)XR38/+ (Wilcoxon rank sum test, corrected for multiple comparisons using a Bonferroni correction). In this and subsequent panels, individual data points are shown, overlaid with boxes indicating the median and first and third quartiles of the data; whiskers show the limits of the distribution. (E) Representative images of anti-Elav immunofluorescence in whole-mount antennae from control (peb-Gal4/+) and PCD-blocked [peb-Gal4/+;UAS-miR(rpr,hid,grim)/+] animals. Scale bar, 10 μm. Right: Quantifications of neuron numbers of these genotypes. ***P = 2.4 × 10⁻⁷ (t test) (n = 19 and 21; control and PCD-blocked, respectively). (F) Representative images of anti-Elav immunofluorescence in whole-mount antennae from control (peb-Gal4/+) and PCD-blocked (peb-Gal4/+;UAS-p35/+) animals. Scale bar, 10 μm. Right: Quantifications of neuron numbers of these genotypes. *P = 0.024 (t test) (n = 10 and 11; control and PCD-blocked, respectively).
