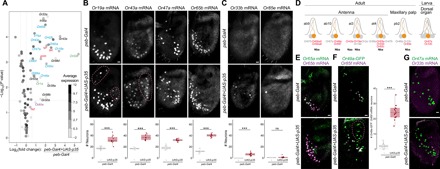
Fig. 3. Undead neurons express a subset of olfactory receptor genes.

(A) Gene expression differences measured by RNA-seq (see Materials and Methods) between control and PCD-blocked antennae. The volcano plot shows the differential expression (on the x axis) of D. melanogaster Or, Ir, and Gr gene transcripts (each gene represented by a dot), as well as the four proapoptotic genes (grim, rpr, hid, and skl; red labels), plotted against the statistical significance (on the y axis). The mean expression level of individual genes across all samples is shown by the shading of the dot, as indicated by the gray scale on the right [units: log2(counts per million)]. Only chemosensory genes showing a >1.5-fold increase in PCD-blocked antennae are labeled: Blue labels indicate genes whose expression in the antenna has previously been demonstrated by RNA in situ hybridization; magenta and green labels indicate receptors normally only expressed in the adult maxillary palps and larval dorsal organ, respectively; and black labels indicate receptors that are expressed in gustatory organs. The horizontal dashed line indicates a false discovery rate threshold of 5%. Data for all Or, Ir, Gr, and proapoptotic genes are provided in table S2. (B) Representative images of RNA FISH for the indicated Or genes in whole-mount antennae of control (peb-Gal4/+) and PCD-blocked (peb-Gal4/+;UAS-p35/+) animals. Scale bar, 10 μm. Quantifications of neuron numbers are shown at the bottom. *** indicates Or19a P = 6.526 × 10⁻⁵ (t test) [n = 17 and 10 (control and PCD-blocked, respectively)], Or43a P = 5.888 × 10⁻⁷ (t test) (n = 10 and 10), Or47a P = 3.088 × 10⁻¹⁰ (t test) (n = 13 and 13), Or65b P = 2.2 × 10⁻¹⁶ (t test) (n = 17 and 11) (see fig. S2A for additional examples). The pink dashed lines encircle cells in PCD-blocked antennae that express the visualized Ors outside their usual spatial domain (see also figs. S2B and S3A). Comparison of the variation in OSN number between control and PCD-blocked antennae indicated only one neuron type—of those in this panel and in figs. S2A and S4—displayed greater variance in PCD-blocked antennae (Or19a P = 0.01; F test for equality of variance, with Bonferroni correction for multiple comparisons). (C) Representative images of RNA FISH for the indicated Or genes in whole-mount antennae of control (peb-Gal4/+) and PCD-blocked (peb-Gal4/+;UAS-p35/+) animals. Scale bar, 10 μm. Quantifications of neuron numbers are shown at the bottom. *** indicates Or33a P = 1.812 × 10⁻⁷ (t test) (n = 23 and 23), ns indicates Or85e P = 0.053 (Wilcoxon rank sum test) (n = 12 and 22). We never detected any Or85e mRNA-positive neurons in control antennae but frequently detected one (or more) labeled cells in PCD-blocked antennae. (D) Schematic summarizing the normal olfactory organ/sensillum expression pattern of the subset of Or genes with higher expression in PCD-blocked antennae that display coexpression in wild-type neurons (highlighted in red; receptor genes showing no changes in transcript levels are in gray). The neuronal precursor identity of these OSNs is shown below. We represent Or69aA and Or69aB as distinct receptors here because, although they share 3′ exons, they are transcribed from different promoters and encode receptors with different odor specificities (15, 56). (These isoforms were not, however, distinguished in the RNA-seq and RNA FISH analyses). (E) Representative images of combined RNA FISH for Or65a (green) and Or65b (magenta) in whole-mount antennae of control (peb-Gal4/+) and PCD-blocked (peb-Gal4/+;UAS-p35/+) animals (n = 4 and 5, respectively), showing coexpression of these receptors in both endogenous and undead neurons. Scale bar, 10 μm. (F) Representative images of RNA FISH for Or85f and anti-GFP in whole-mount antennae of control (peb-Gal4/+;Or49a-GFP/+) and PCD-blocked (peb-Gal4/+;Or49a-GFP/UAS-p35) animals. Scale bar, 10 μm. Quantifications of coexpression are shown to the right. *** indicates Or49a-GFP+/Or85f mRNA− population P = 5.48 × 10⁻¹² (t test) (n = 16 and 15; control and PCD-blocked, respectively). The pink dashed line encircles cells in the PCD-blocked antenna that express Or49a-GFP outside the usual spatial domain (see also fig. S2B). We used an Or49a-GFP reporter due to our inability to reliably detect Or49a transcripts in situ; the higher number of Or49a-GFP+/Or85f mRNA− negative cells is not an artifact of the detection method, as an Or85f-GFP reporter revealed a similarly limited increase in neuron number (fig. S3B). (G) Representative images of combined RNA FISH for Or47a (green) and Or33b (magenta) in whole-mount antennae of control (peb-Gal4/+) and PCD-blocked (peb-Gal4/+;UAS-p35/+) animals. In control animals, Or33b is coexpressed with Or47a in the larval dorsal organ and is never detected in the antenna. In PCD-blocked antennae, Or33b- and Or47a-expressing undead neurons are almost completely nonoverlapping: 4% of Or33b-positive undead OSNs weakly coexpress Or47a (n = 79 cells from 10 antennae). Scale bar, 10 μm.
