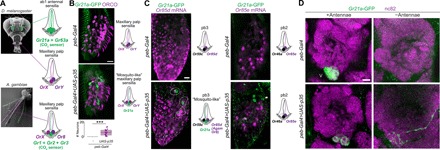
Fig. 6. PCD can explain an evolutionary difference in CO2-sensing neuron formation in D. melanogaster and mosquitoes.

(A) Left: Scanning electron micrographs of D. melanogaster and Anopheles gambiae heads indicating the two olfactory organs: antennae (blue) and maxillary palps (magenta) [adapted from (3), with permission]. Right: Schematic illustrating that, in D. melanogaster, CO2-sensing neurons (green) are located in antennal ab1 sensilla and maxillary palp sensilla house only two Or neurons. By contrast, in A. gambiae (and other mosquitoes), CO2-sensing neurons are located in the maxillary palp, housed together with two Or neurons. (B) Representative images of combined anti-ORCO (the OR coreceptor, which labels all OR neurons) and anti-GFP immunofluorescence in whole-mount maxillary palps of control (peb-Gal4/+;Gr21a-GFP/+) and PCD-blocked (peb-Gal4/+;Gr21a-GFP/UAS-p35) animals. Scale bar, 10 μm. Quantifications of Gr21a-GFP–positive neuron numbers are shown at the bottom; *** indicates P = 6.7 × 10⁻⁹ (Wilcoxon rank sum test) [n = 22 and n = 21 (control and PCD-blocked, respectively)]. Schematic of inferred maxillary palp sensilla organization in each genotype is illustrated on the right. (C) Representative images of combined RNA FISH for the indicated Or genes (magenta) and anti-GFP immunofluorescence (green) in whole-mount maxillary palps of control (peb-Gal4/+;Gr21a-GFP/+) and PCD-blocked (peb-Gal4/+;Gr21a-GFP/UAS-p35) animals. Schematic of the inferred maxillary palp sensilla organization in each genotype is illustrated on the right. GFP-positive neurons pair with Or85d OSNs in pb3 sensilla (encircled by dashed lines) but not Or85e OSNs in pb2 sensilla (arrowheads). (D) Representative images of combined anti-GFP and nc82 immunofluorescence in whole-mount brains of control (peb-Gal4/+;Gr21a-GFP/+) and PCD-blocked (peb-Gal4/+;Gr21a-GFP/UAS-p35) animals with antennae intact (left) or excised (right). Blind categorization of brains from animals lacking antennae as control (n = 19) or PCD-blocked (n = 17) (visualizing only the GFP channel of confocal stacks and based exclusively on the presence of GFP-labeled axons) was 94.4% accurate. Scale bar, 10 μm. Additional representative images are provided in fig. S7.
