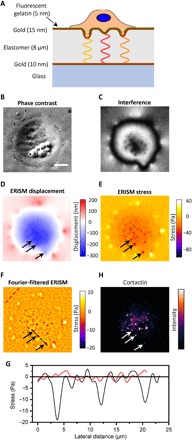
Fig. 1. ERISM for measuring the mechanical activity of invadopodia formed by UM-SCC-1 cancer cells.

(A) Schematic sketch of the ERISM measurement, illustrating how invadopodia forces against an elastic microcavity, formed by two gold films sandwiching a soft elastomer, lead to local changes in the thickness and resonance wavelengths of the microcavity. The microcavity substrate is coated with fluorescent gelatin (green line) to distinguish mature (degrading) from immature (nondegrading) invadopodia. (B) Phase-contrast image of UM-SCC-1 cell attached to the microcavity surface. (C) Coregistered monochromatic reflectance image of the microcavity, for illumination with 676-nm light. (D) ERISM thickness map obtained from a series of reflectance images, showing the substrate deformation induced by the same cell. Black arrows indicate three local indentation features. (E) ERISM stress map and (F) ERISM stress map after application of Fourier band-pass filter. (G) Lateral stress profile along the black and red dashed lines in (F). (H) Epifluorescence image of the same cell after immunostaining for cortactin. Scale bar, 10 μm.
