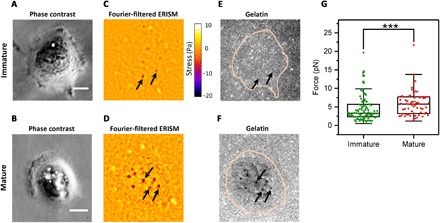
Fig. 2. Correlation of invadopodial force with matrix degradation.

(A and B) Phase-contrast images of two representative UM-SCC-1 cells with immature and mature invadopodia, respectively. (C and D) Fourier-filtered ERISM stress map of same cells, with arrows indicating representative invadopodia in each cell. (E and F) Epifluorescence image of fluorescent gelatin film on the surface of the ERISM substrate. Pink lines indicate the outline of cells. The maturity of invadopodia was classified by analysis of local gelatin fluorescence. (G) Comparison between force exerted by mature (n = 66) and immature (n = 92) invadopodia. Each data point represents the mean force exerted by an invadopodium over a 1-hour time frame. Plots indicate data (diamonds), median (center), mean (open square), Q1/Q3 (box), and ±1.5 SD (whiskers). As data in groups were not normally distributed, groups were compared using the Mann-Whitney U test (***P < 0.001). Scale bars, 10 μm.
