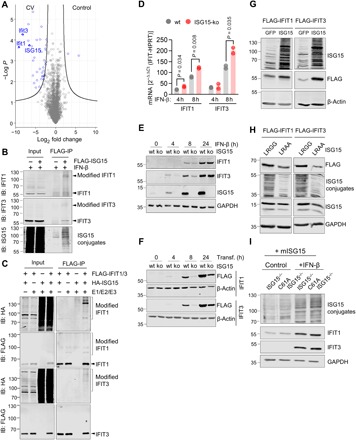
Fig. 3. ISGylation increases expression levels of IFIT1/3 proteins.

(A) Liver samples obtained from wild-type (wt) mice (n = 3) before and 3 days after infection were subjected to LC-MS/MS analysis. In the depicted volcano plots, each protein identified at baseline and after CV infection in the proteome screen of liver tissue is represented by a dot. The x axis specifies log2 fold changes and the y axis specifies −log10 of P values obtained from t test. (B) 3×FLAG-6×His-ISG15-HeLa cells and controls were stimulated with IFN-β for 24 hours, and cellular lysates were subjected to FLAG immunoprecipitation (IP). Total cell lysates (input) and FLAG-IP enriched proteins were immunoblotted using antibodies for ISG15, IFIT3, and IFIT1. Data are representative of three independent experiments. (C) HeLa cells transfected with a four-plasmid combination (HA-ISG15, Ube1L, Ube2L6, and Herc5) and with either FLAG-tagged IFIT1 or IFIT3 were subjected to pull-down experiments using anti-FLAG agarose beads. Total cell lysates and FLAG-immunoprecipitated proteins were subjected to immunoblotting using antibodies for FLAG and HA. Data are representative of three independent experiments. (D and E) ISG15-ko HeLa cells generated by CRISPR-Cas9–mediated gene editing and respective control cells were stimulated with IFN-β (100 U/ml). IFIT1/IFIT3 transcripts and IFIT1/IFIT3 protein expression levels were determined by (D) TaqMan qPCR and (E) Western blot analysis. One representative of three independently performed experiments is shown. Unpaired t tests were conducted. (F) ISG15-ko HeLa cells and controls were transfected with plasmids encoding either FLAG-tagged IFIT1 or IFIT3, and IFIT expression was determined by Western blot analysis. Date are representative of three independent experiments. (G) ISG15-ko HeLa cells were transfected with either GFP or ISG15 cDNA together with IFIT1 or IFIT3 expression plasmids, respectively. Subsequently, cells were stimulated with IFN-β for 24 hours, and IFIT protein expression levels were determined by Western blot analysis. Data are representative of two independent experiments. (H) Following the experimental approach outlined in (G), ISG15-ko cells were transfected with either ISG15 or the unconjugatable ISG15-LRAA mutant as well as with IFIT1/3 cDNA. IFIT protein expression was determined after 24 hours by Western blot analysis. Data are representative for three independent experiments. (I) Primary cardiomyocytes were generated from USP18C61A ISG15−/− and ISG15−/− mice, and ISGylation was induced by transduction of Ad5 vectors encoding mISG15. Cells were left unstimulated or stimulated with IFN-β (100 U/ml) to induce the expression of endogenous IFIT1 and IFIT3.
