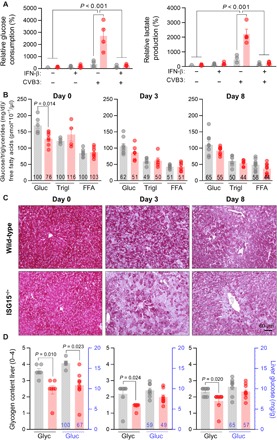
Fig. 4. ISG15 influences the metabolic state in healthy mice and during CV infection.

(A) Unstimulated or IFN-β pretreated, ISG15-ko HeLa, and control cells were infected with CV (MOI 1.0). After 32 hours, the glucose and lactate concentrations were determined in cell culture supernatants. Values normalized to cell counts per well are presented as increase relative to the untreated wild-type control. The data of four independent experiments have been summarized as means ± SEM. A two-way ANOVA test was performed followed by a Sidak’s multiple comparison test. (B to D) Wild-type (wt) and ISG15−/− mice sacrificed before (wild-type, n = 7; ISG15−/−, n = 7), 3 days (wild-type, n = 8; ISG15−/−, n = 6), and 8 days (wild-type, n = 9; ISG15−/−, n = 8) after CV infection. (B) Blood glucose and serum triglycerides/FFAs at baseline and 3 and 8 days after CV infection in wild-type and ISG15−/− mice summarized as the means ± SEM. Numbers in bar graphs are the percentage of the metabolite compared to the mean value in naive wild-type mice. Multiple t tests with Holm-Sidak multiple comparison correction were performed. (C) Glycogen content visualized in liver tissue section with periodic acid Schiff reaction. Representative images are shown. (D) Glycogen content scored semiquantitatively from 0 to 4 based on histological analysis and glucose concentration assessed in liver tissue homogenates. Bars are means ± SEM. Multiple t tests with Holm-Sidak multiple comparison correction were performed; P values are depicted.
