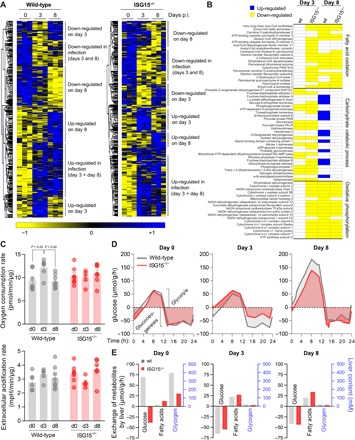
Fig. 5. ISG15 reprograms the central liver metabolism during CV infection.

(A) Hepatic tissue obtained from wild-type (wt) and ISG15−/− mice (n = 3) during early (day 3) and late (day 8) state of CV infection was subjected to LC-MS/MS analysis. Heatmaps summarizing all differentially regulated hepatic proteins during infection for both strains are depicted. The relative abundance of each protein is color-coded based on the z score normalized log2-transformed LFQ intensities. Blue color indicates proteins of high abundance, and yellow color indicates proteins of low abundance as compared to row means. A hierarchical clustering resolved six distinct clusters, with annotation shown on the right. (B) Heatmap-based clusters were subjected to Gene Ontology (GO) analysis, and proteins involved in selected enriched metabolic GO terms with catabolic ATP-generating function (FA oxidation, carbohydrate catabolic process, and OXPHOS) are depicted at an early and late state of CV infection, applying the same color code as used in (A) (blue, up-regulation; yellow, down-regulation). If the GO term of interest was not found within a dataset, individual proteins were not plotted. (C) At the indicated time points of infection, liver biopsies were obtained from wild-type and ISG15−/− mice. The basal oxygen consumption (top) and extracellular acidification (bottom) rates were monitored using a Seahorse Biosciences extracellular flux analyzer. Values were normalized to protein content in the biopsies. Data of at least six mice per group were summarized as means ± SEM. A one-way ANOVA was performed followed by a Tukey’s multiple comparison test. (D and E) Liver proteome data together with HEPATOKIN1, a model of central liver metabolism (43), were used to assess the metabolic alterations in liver tissue of wild-type and ISG15−/− mice during viral infection. Metabolic models for the different conditions were constructed by scaling the maximal activity for each enzyme using the LFQ intensities for each protein obtained from MaxQuant analysis at the respective point in time. (D) For a standard 24-hour profile metabolite plasma profile, diurnal glucose exchange fluxes were simulated in wild-type and ISG15−/− mice at each time point of viral infection. Negative exchange fluxes indicate net release from the liver to the plasma (gluconeogenesis), while positive values indicate hepatic glucose uptake (glycolysis). (E) For each condition, experimentally determined blood glucose levels as depicted in Fig. 4B were used as model input to calculate realistic exchange fluxes and glycogen levels.
