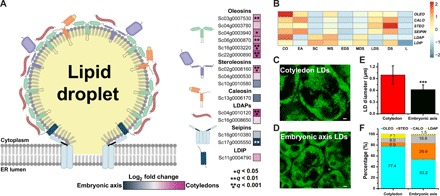
Fig. 4. Gene expression and protein levels of associated with jojoba LDs.

(A) Illustration representing an LD budding from the surface of the endoplasmic reticulum (ER) adorned with various proteins. Colored boxes (blue to magenta scale) adjacent to gene names indicate gene expression bias toward embryonic axis tissues (blue) or toward cotyledon tissues (magenta) and represent a log2 fold change of expression levels (n = 5, *q < 0.05, **q < 0.01, ***q < 0.001). (B) Heat map of gene expression levels of genes involved in LD storage and packaging across different jojoba seed tissues and developmental stages. LDAP, lipid droplet-associated protein; LDIP, LDAP-interacting protein. (C and D) Confocal micrographs of BODIPY-stained LDs from tissues of jojoba (C) cotyledon and (D) embryonic axis tissues. (E) Size comparison of LDs from jojoba cotyledons and embryonic axis tissues. Student’s t test was used to calculate significance where *** is P < 0.001. (F) Bar graph (of 100%) representing an estimation of the percentage of oleosin, steroleosin, caleosin, and LDAP proteins on LDs from jojoba cotyledons and embryonic axis tissues. Proportions of known LD proteins were calculated from normalized MS peptide counts.
