
Fig. 5. The hCD11b mouse is susceptible to MRSA infection.
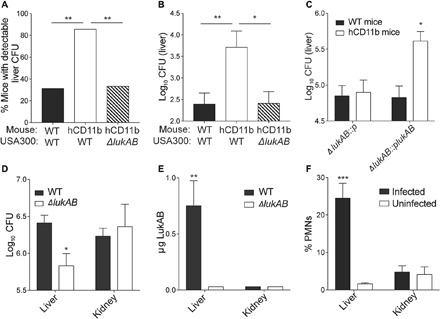
(A and B) WT and hCD11b mice were infected intravenously with ~3 × 10⁶ CFU of WT USA300 strain LAC or an isogenic ΔlukAB LAC strain. Three days after infection, % of mice with detectable CFUs in the liver was determined (A). Statistical significance was determined by chi-square test (**P < 0.01). (B) CFUs in the livers were also quantified. Data are represented as the average of three independent experiments with 15 total mice per group. Statistical significance was determined by one-way ANOVA (**P < 0.01 and *P < 0.05). (C) WT and hCD11b mice were infected intravenously with 1 × 10⁷ ΔlukAB::p LAC or ΔlukAB::plukAB LAC. One day after infection, CFUs in the livers were quantified. Data are represented as the average of two independent experiments with 10 total mice per group. Statistical significance was determined by one-way ANOVA (*P < 0.05). (D and E) hCD11b mice were infected intravenously with 1 × 10⁸ CFU of WT LAC or an isogenic ΔlukAB LAC strain. (D) CFUs in the livers and kidneys 1 day after infection. (E) Tissue homogenates from (D) were also used to quantify LukAB. Data are represented as the average of three independent experiments with 15 total mice per group. Statistical significance was determined by one-way ANOVA (**P < 0.01). See also fig. S4. (F) WT mice were infected with S. aureus intravenously. One day after infection, the % Ly6G+ CD11b+ PMNs out of the total CD45% leukocytes were quantified. Data are represented as the average of two independent experiments with six total mice per group. Statistical significance was determined by one-way ANOVA (***P < 0.001).