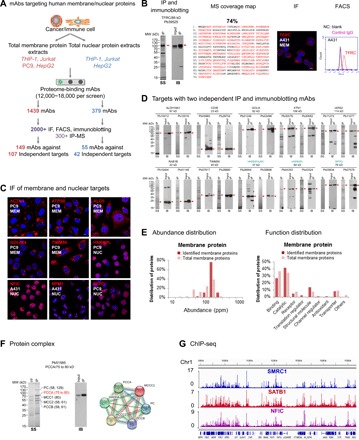
Fig. 3. Proteome-scale antibody generation for human membrane and nuclear proteomes.

(A) Protein identification for human membrane and nuclear proteome-specific PETAL mAbs. (B) An example (TFRC/CD71) for identification of antibody binding protein. From left to right: SS for IP product, IB blot of input and after IP samples, coverage map of MS-identified peptides, and IF and FACS data. The cell line for IF was selected according to HPA data. Membrane or nuclear proteins were labeled MEM or NUC. Negative controls (NC) for FACS included staining with blank and irrelevant IgG. (C) Examples of IF data for endogenously expressed membrane and nuclear proteins. ACTN4 and ACTP5B were stained under nonpermeable conditions. Other proteins were stained under permeable staining conditions (also, see movies S1 to S6). (D) Proteins with two independent IP and immunoblotting mAbs. Panel label (SS and IB) was the same as in (B). Nuclear proteins were labeled in blue. (E) Abundance and function distribution of proteins identified from the Jurkat cell membrane proteome. (F) Protein interactome example using Pb51585 against PCCA. Protein-protein interacting map (right) analyzed by STRING with the mass-identified proteins. (G) Snapshot of the Integrative Genomics Viewer showing sequencing read density of ChIP-seq data generated with antibodies against SMRC1, SATB1, and NFIC in HepG2 cells. Chr1, chromosome 1.
